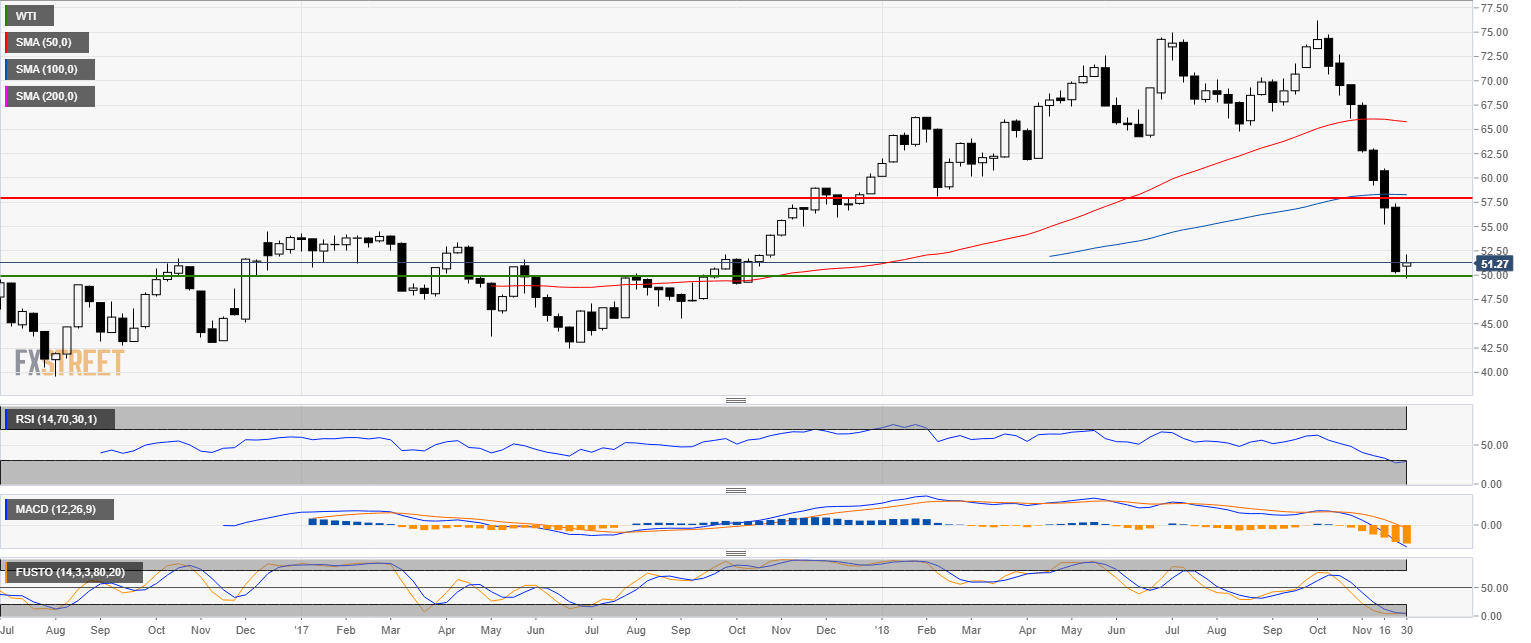
Crude oil weekly chart
- Oil is about to end the week virtually unchanged for the first time in 7 weeks.
- The RSI and Stochastic are in oversold condition.
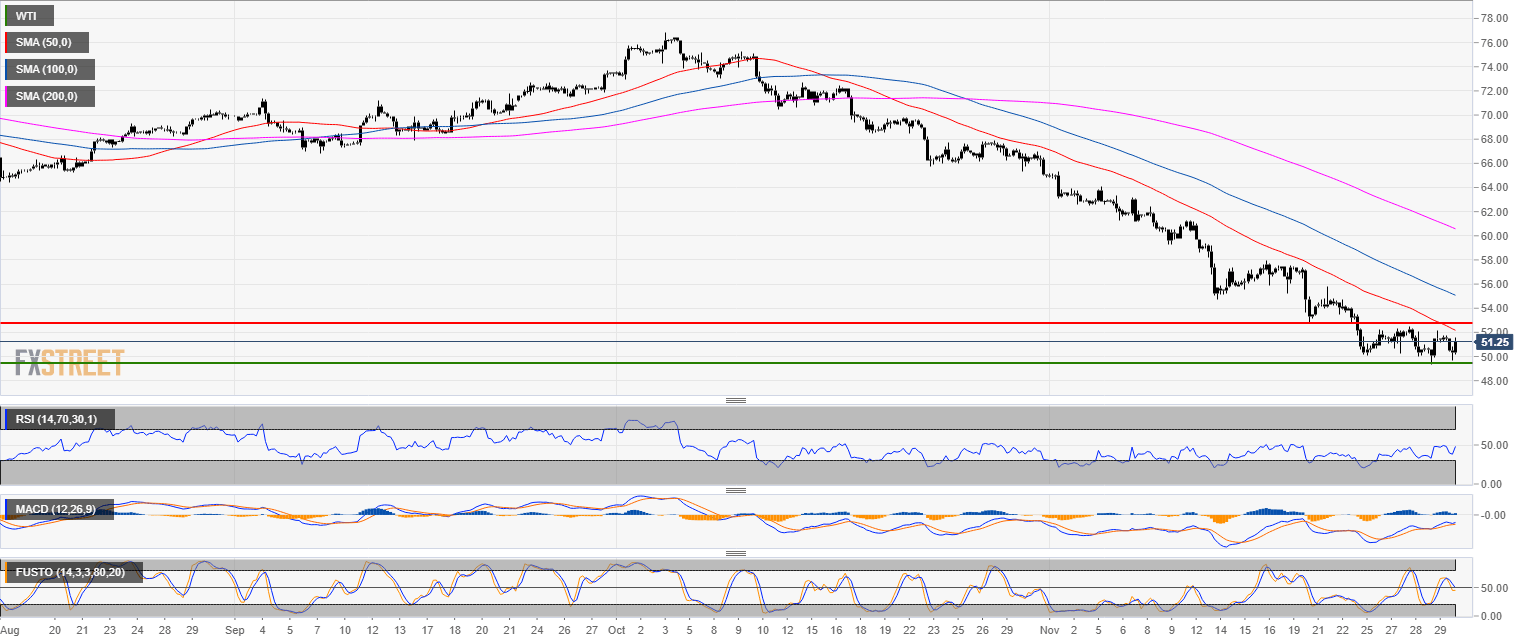
Crude oil 4-hour chart
- Oil is trading in a strong bear trend below its main simple moving averages (SMAs).
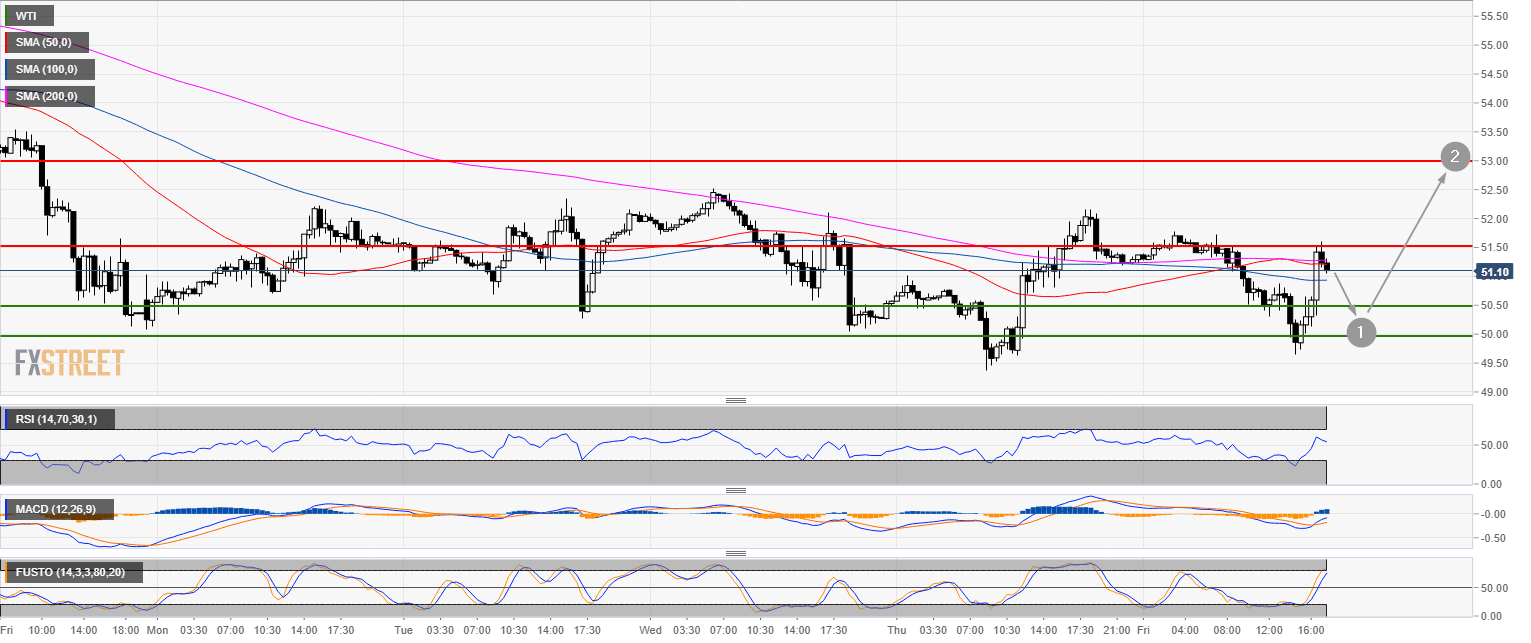
Crude oil 30-minute chart
- Bears objective is to bring back the market to 50.50 while bulls will try to push the market to the 53.00 figure next week.
Additional key levels
WTI
Overview:
Today Last Price: 51.19
Today Daily change: -18 pips
Today Daily change %: -0.350%
Today Daily Open: 51.37
Trends:
Previous Daily SMA20: 55.49
Previous Daily SMA50: 63.66
Previous Daily SMA100: 66.4
Previous Daily SMA200: 67.68
Levels:
Previous Daily High: 51.38
Previous Daily Low: 51.2
Previous Weekly High: 57.42
Previous Weekly Low: 50.13
Previous Monthly High: 76.25
Previous Monthly Low: 64.86
Previous Daily Fibonacci 38.2%: 51.31
Previous Daily Fibonacci 61.8%: 51.27
Previous Daily Pivot Point S1: 51.25
Previous Daily Pivot Point S2: 51.14
Previous Daily Pivot Point S3: 51.07
Previous Daily Pivot Point R1: 51.43
Previous Daily Pivot Point R2: 51.5
Previous Daily Pivot Point R3: 51.61
