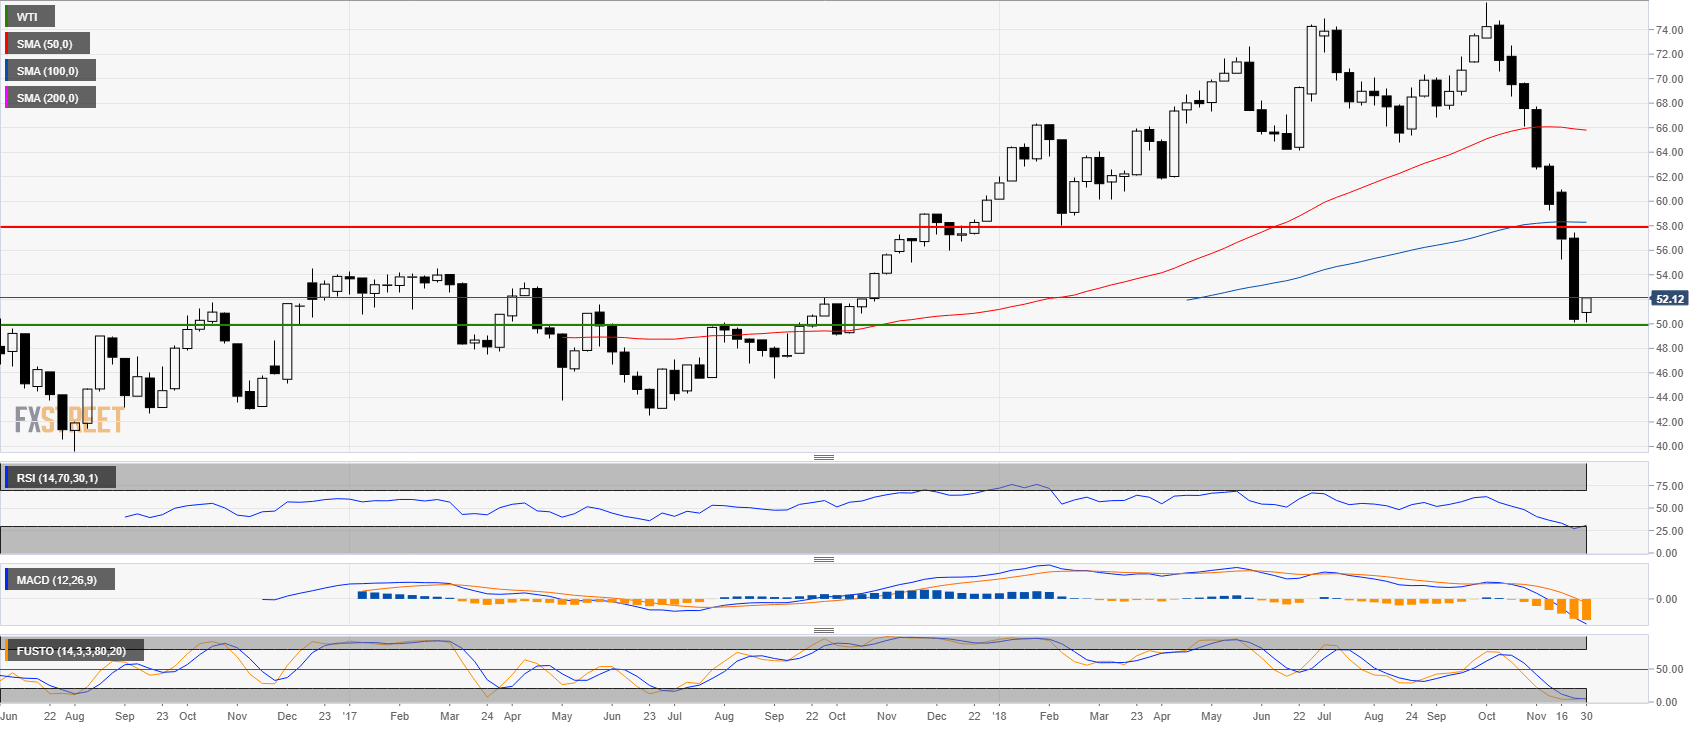
Crude oil weekly chart
- Crude oil has erased the yearly gains.
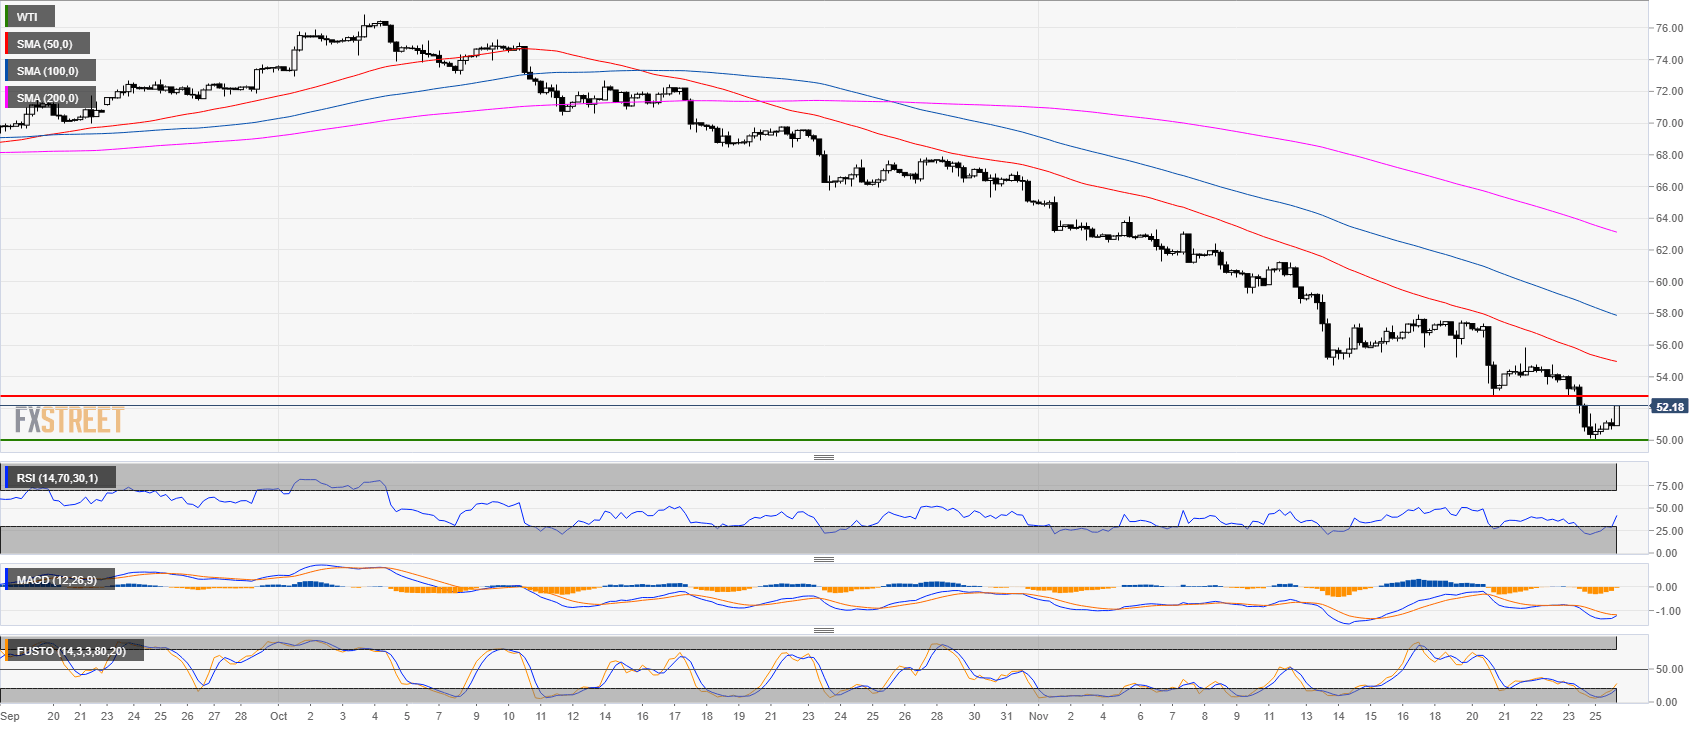
Crude oil 4-hour chart
- Oil is trading in a strong bear trend below its main simple moving averages (SMAs).
- Bulls next objective is to reach 57.74 resistance.
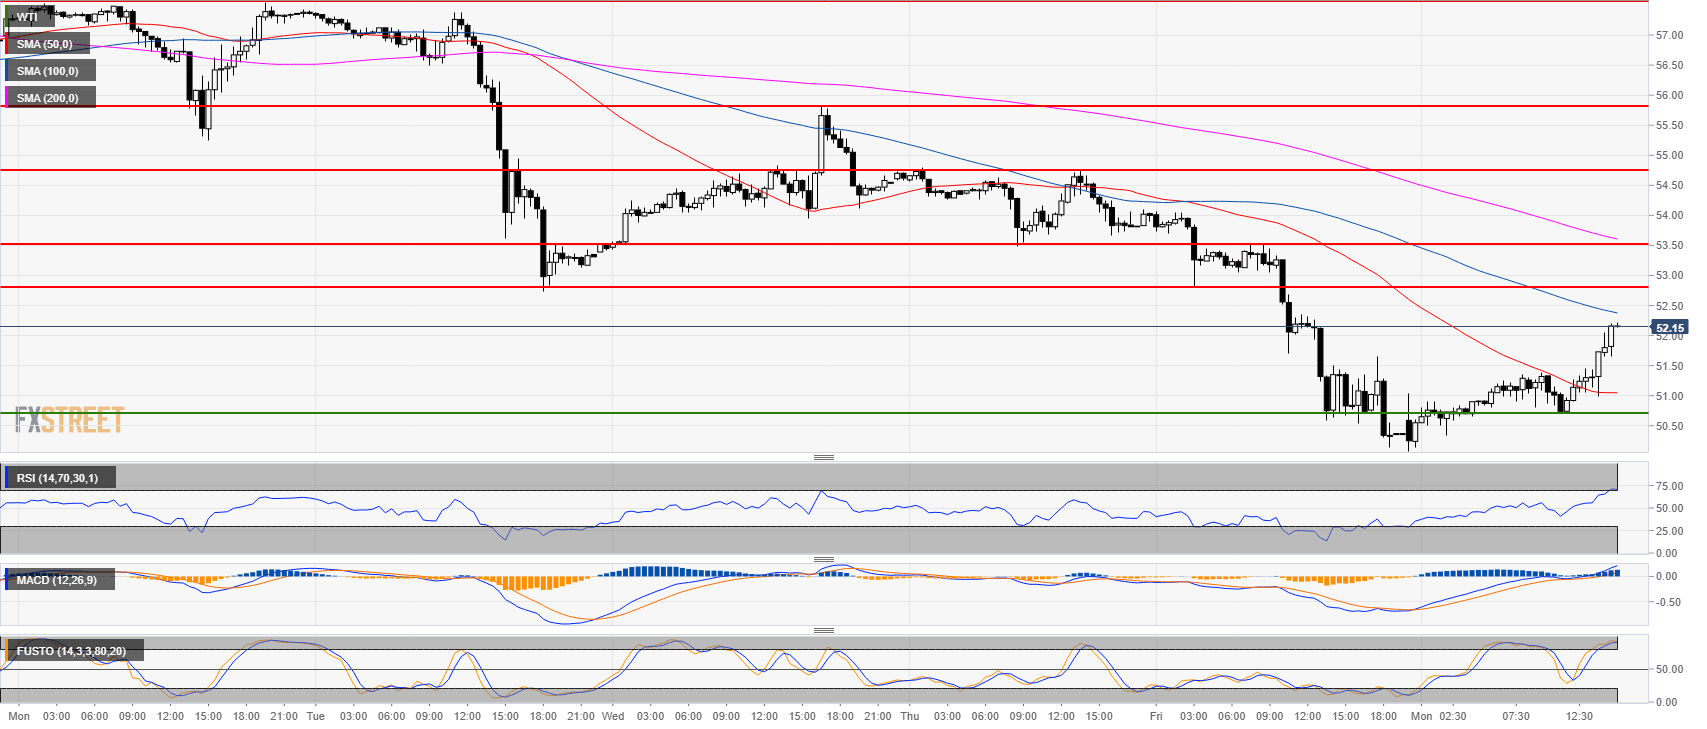
Crude oil 30-minute chart
- Oil is starting the week on a strong note after seeing relentless selling pressure last week.
- Oil is trading back above its 50 SMA while technical indicators are in positive territories.
Additional key levels
WTI
Overview:
Today Last Price: 52.17
Today Daily change: 1.6e+2 pips
Today Daily change %: 3.20%
Today Daily Open: 50.55
Trends:
Previous Daily SMA20: 57.74
Previous Daily SMA50: 65.5
Previous Daily SMA100: 67.09
Previous Daily SMA200: 67.92
Levels:
Previous Daily High: 51.04
Previous Daily Low: 50.08
Previous Weekly High: 57.42
Previous Weekly Low: 50.13
Previous Monthly High: 76.25
Previous Monthly Low: 64.86
Previous Daily Fibonacci 38.2%: 50.45
Previous Daily Fibonacci 61.8%: 50.67
Previous Daily Pivot Point S1: 50.07
Previous Daily Pivot Point S2: 49.6
Previous Daily Pivot Point S3: 49.11
Previous Daily Pivot Point R1: 51.03
Previous Daily Pivot Point R2: 51.52
Previous Daily Pivot Point R3: 51.99
