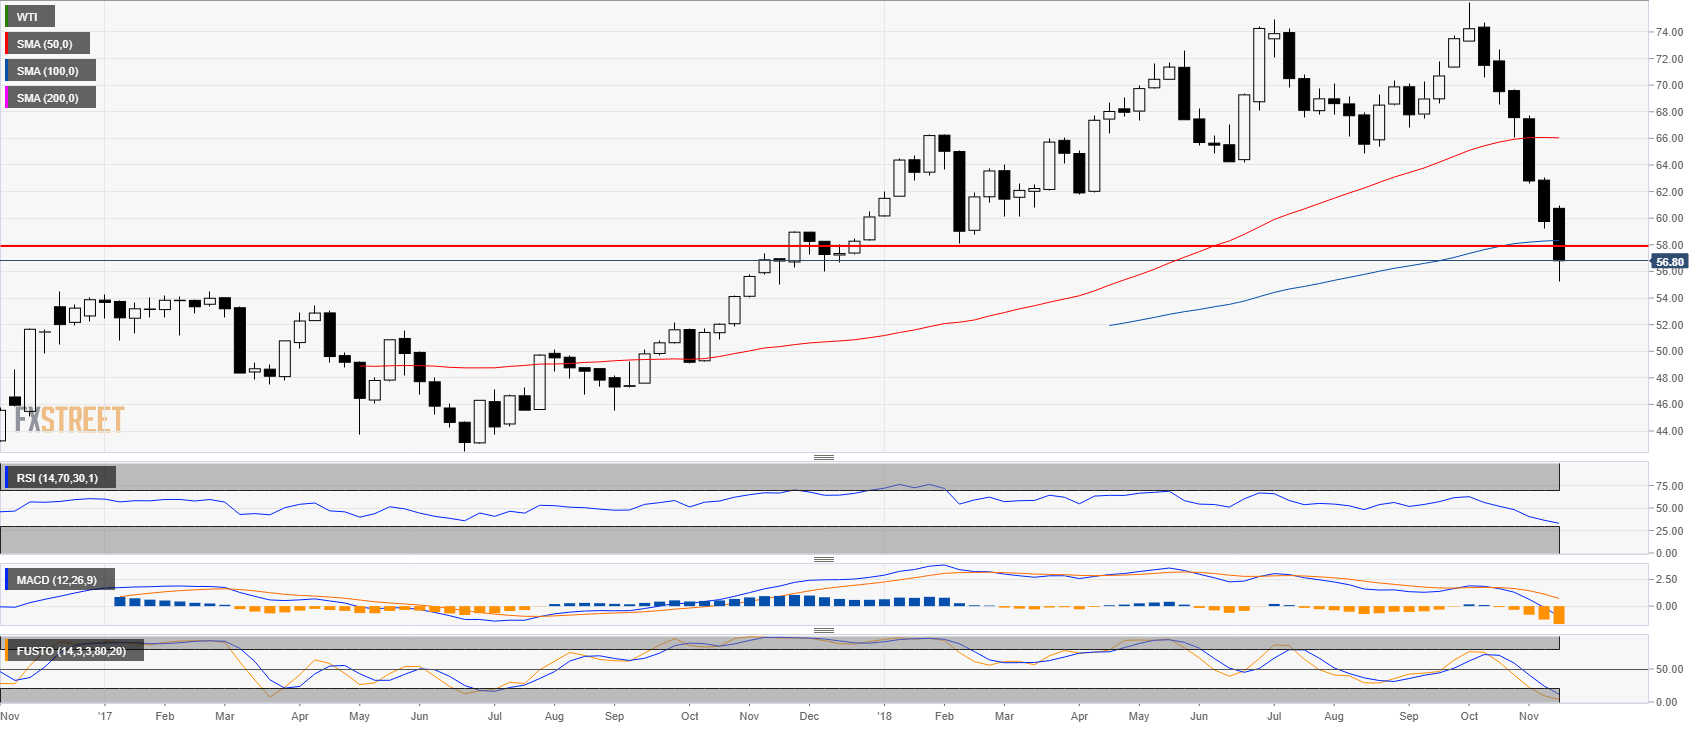
Crude oil weekly chart
- Crude oil has erased the yearly gains as it plunged below the 58.00 level.
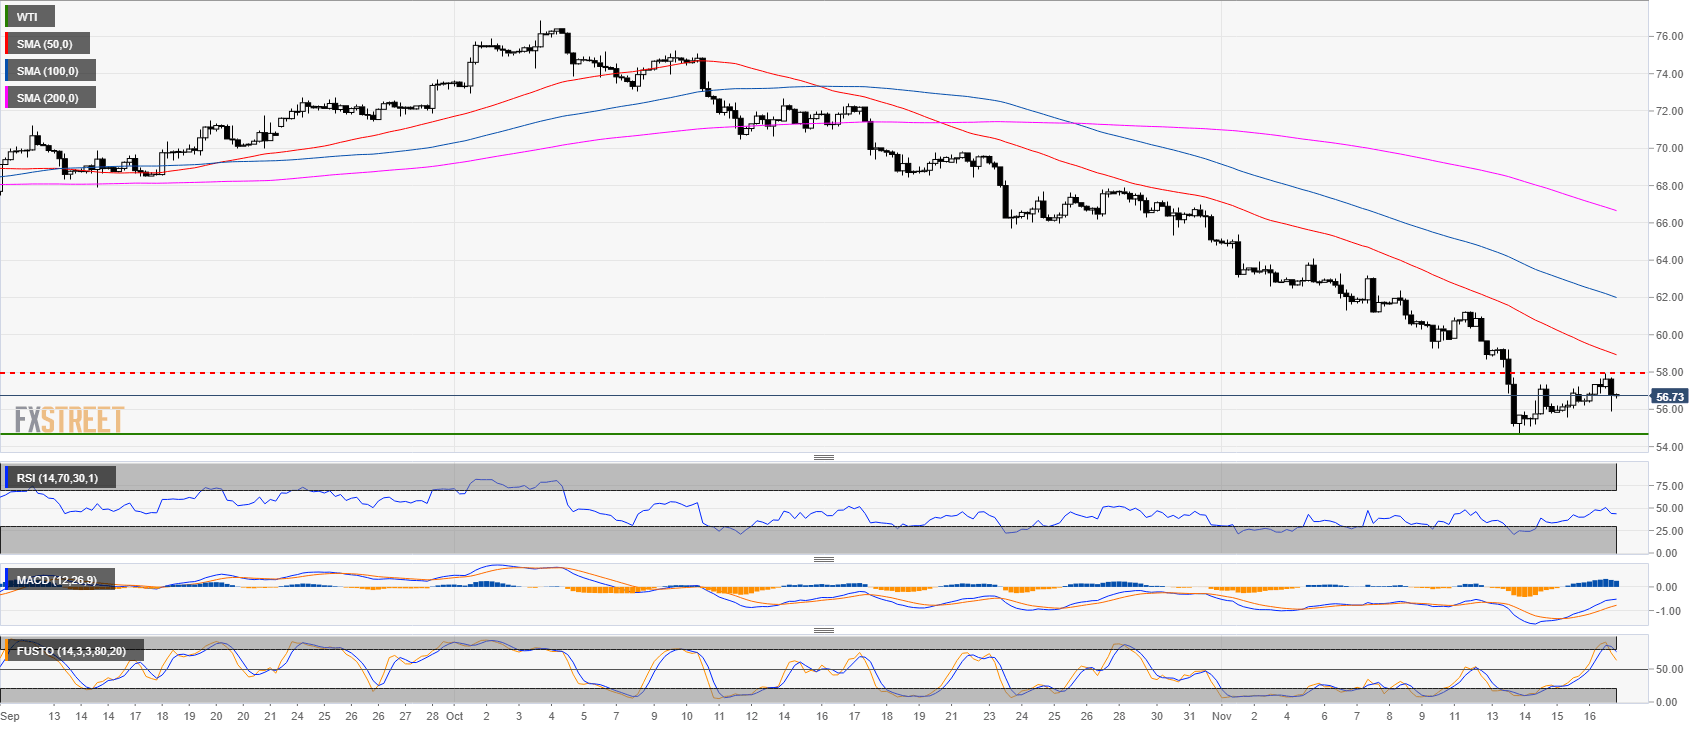
Crude oil 4-hour chart
- Crude oil gave back most of its intraday gains this Friday as it tested the 58.00 level.
- However, giving the recent bullish momentum, it is likely that bulls will give another try at breaking above 58.00 before a break to a new 2018 low.
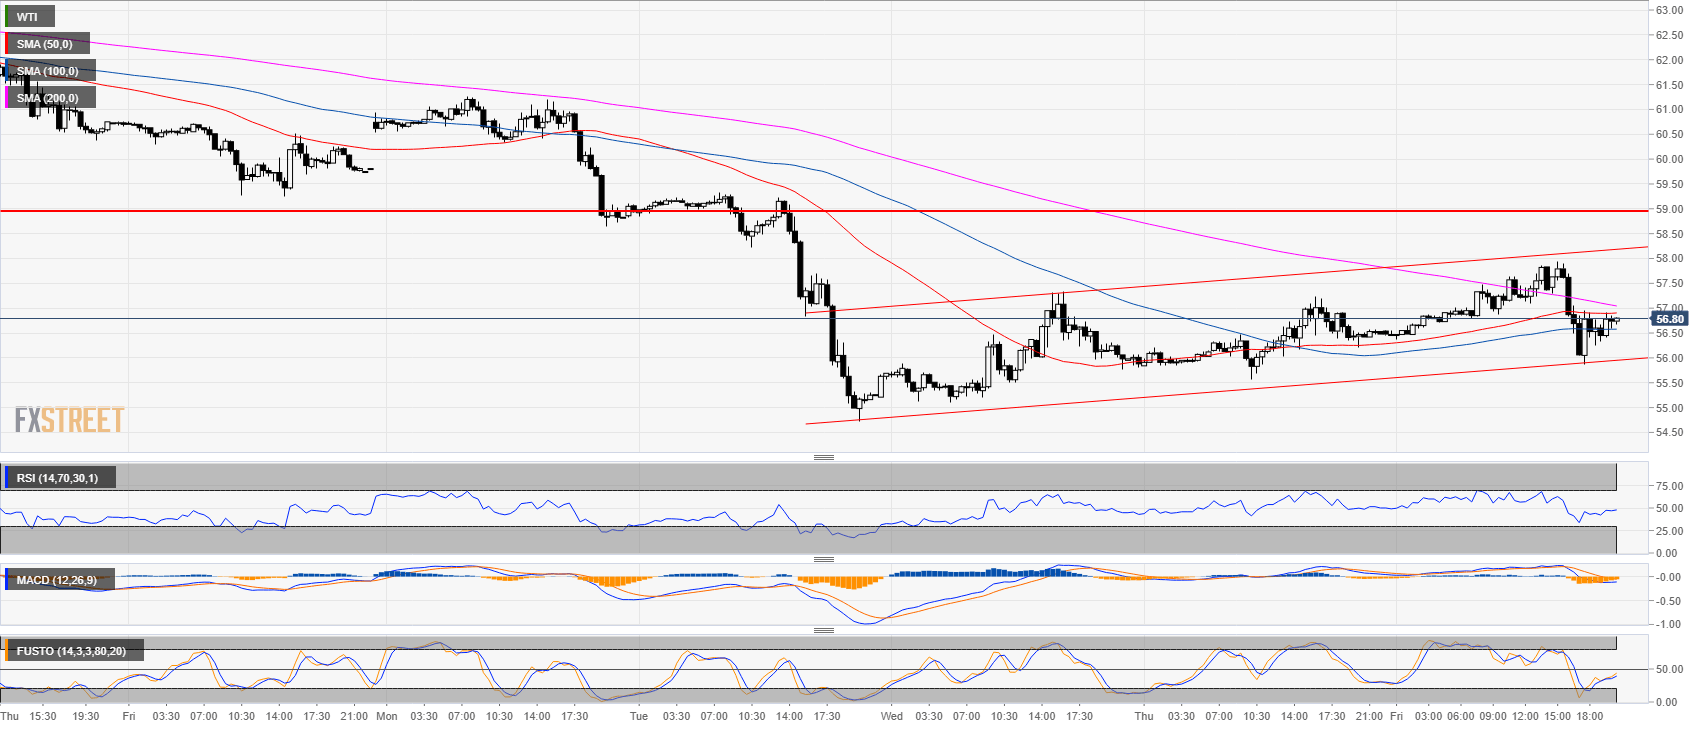
Crude oil 30-minute chart
- Crude oil is evolving in a bull channel supported by the 100-period simple moving average.
Additional key levels at a glance:
WTI
Overview:
Last Price: 56.73
Daily change: 28 pips
Daily change: 0.496%
Daily Open: 56.45
Trends:
Daily SMA20: 62.52
Daily SMA50: 68.23
Daily SMA100: 68.26
Daily SMA200: 68.31
Levels:
Daily High: 56.56
Daily Low: 56.45
Weekly High: 63.05
Weekly Low: 59.24
Monthly High: 76.25
Monthly Low: 64.86
Daily Fibonacci 38.2%: 56.49
Daily Fibonacci 61.8%: 56.52
Daily Pivot Point S1: 56.41
Daily Pivot Point S2: 56.38
Daily Pivot Point S3: 56.3
Daily Pivot Point R1: 56.52
Daily Pivot Point R2: 56.6
Daily Pivot Point R3: 56.63
