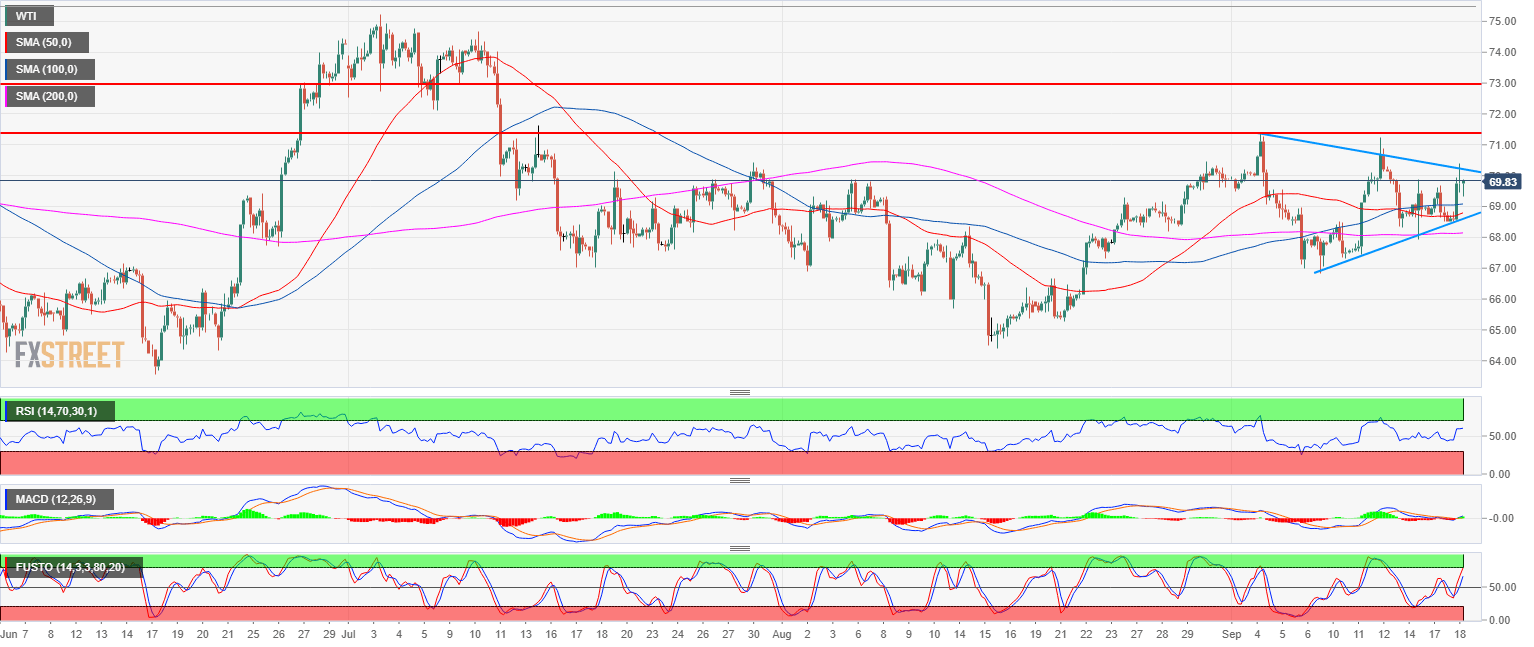
- Crude oil WTI main bull trend is consolidating in a triangle pattern.
- Crude oil WTI is trading above its flat 50, 100 and 200-period simple moving average while the RSI, MACD and Stochastics are slowly ticking up. Targets to the upside can be located near 71.41 (September 4 high) and 73.00 figure and supply level.
- A break below $68.00 a barrel would likely invalidate the bullish bias.
Spot rate: 69.81
Relative change: 1.75%
High: 70.39
Low: 68.51
Main Trend: Bullish
Resistance 1: 70.00 figure
Resistance 2: 70.53 May 24 low
Resistance 3: 71.41 September 4 high
Resistance 4: 73.00 figure and supply level
Support 1: 69.44 June 25 high
Support 2: 69.30 August 24 high
Support 3: 69.00 figure.
Support 4: 68.00-68.30 zone, figure and supply/demand level
Support 5: 67.84 August 14 swing high
Support 6: 67.16 June 14 high
Support 7: 67.72 June 26 low
Support 8: 66.87 September 7 low
