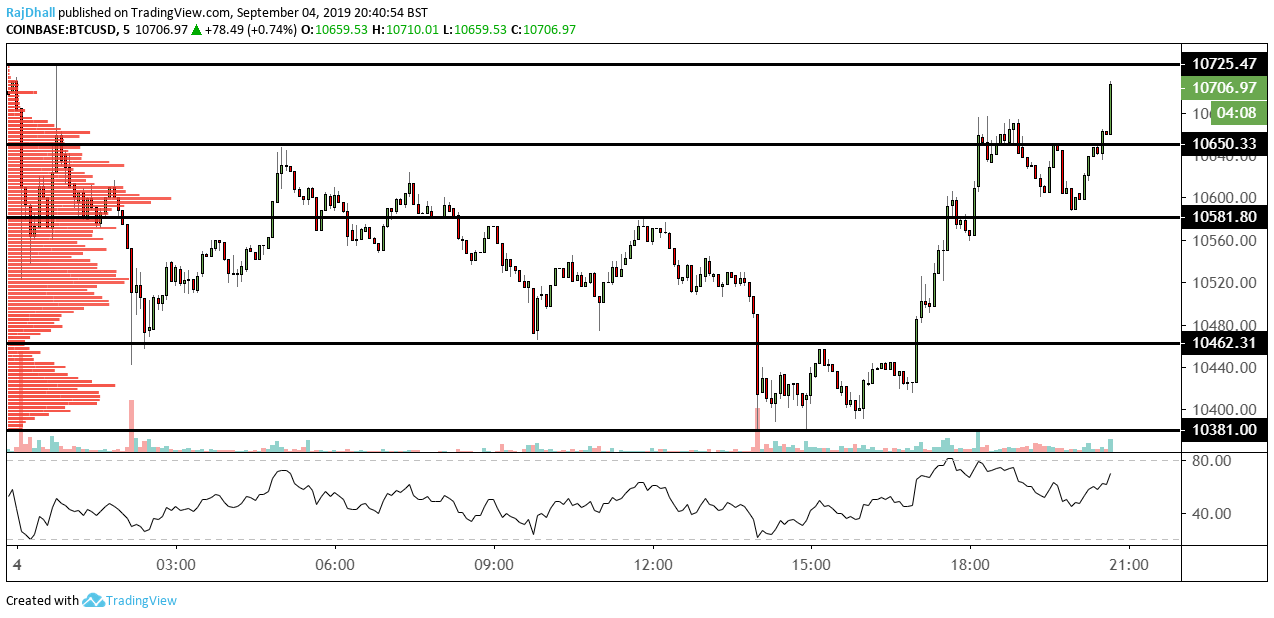
BTC/USD technical analysis: We are about to test the intraday highs
BTC/USD is moving higher as a sudden surge of volume pushes into the market.
The RSI indicator is showing a divergence as price waves make a higher high and the indicator makes a lower high. This sometimes shows a loss in momentum but in this case, momentum seems strong.
10,725 is the next resistance as it is the daily high. Above that is 10,955 and the psychological level of 11k. Yesterday’s high stands at 10,790 which could be a problem.
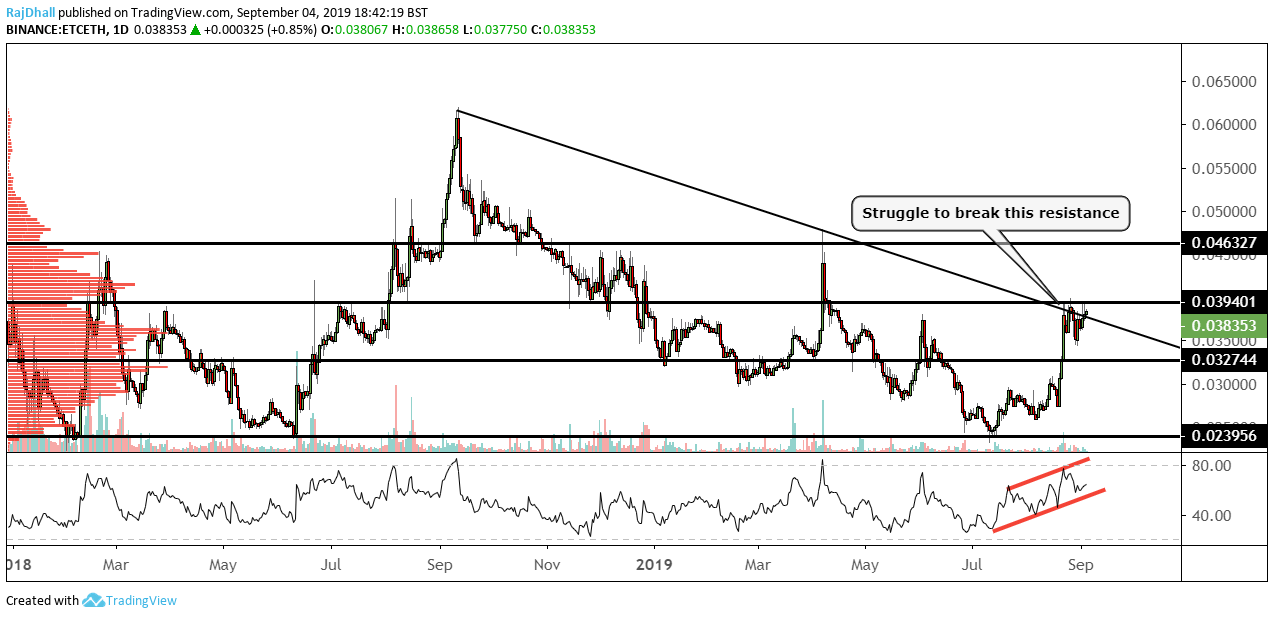
Ethereum Classic vs Ethereum technical analysis
ETC/ETH looks to have stalled on the daily chart above. There was a key trendline that price broke indicating more upside movement but since the move has not really materialized.
The 0.03940 level looked like a pretty strong resistance level in any case but after the momentum seen yesterday, you would be forgiven if you thought it would have continued.
Now on the downside, there are two scenarios in focus. One is the retest of the trendline at a lower level and a move back up. The second would be a move lower to test the 0.03274 support level.
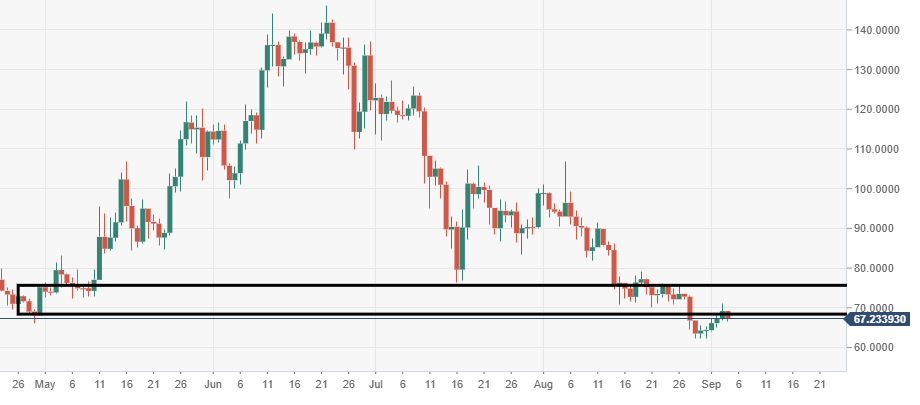
Litecoin technical analysis: LTC/USD bulls retesting breached bearish pennant structure
Litecoin price on Wednesday is trading in positive territory by 3.80% in the second half of the session. LTC/USD upside is going to be heavily capped by a strong prior support zone seen at $70. Market bulls faced a rejection here in session on Tuesday.
The bulls are retesting a breached pennant structure, which at present continues to contain the price.