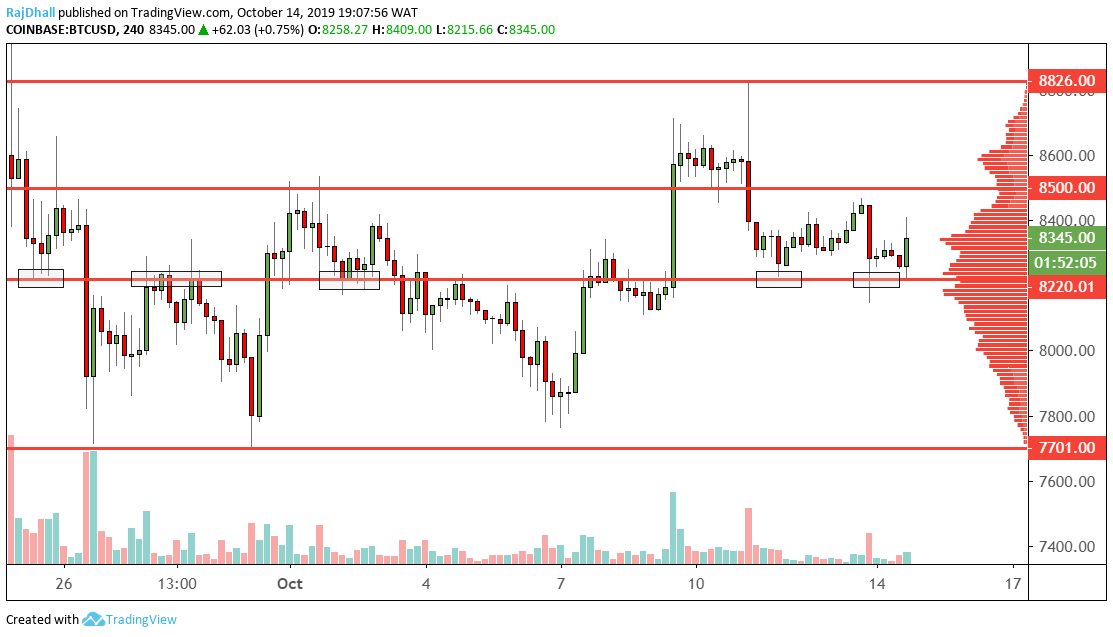
BTC/USD technical analysis: Volume is looking thin as the market looks to break 8.5K
The four hour chart below is showing the price in its consolidation zone between 8,826 and 7,701.
Today price is right in the middle of the consolidation zone and it holding at the mean value area represented by the volume profile indicator on the right-hand side of the chart.
There is also a support zone at 8,220 which is marked by the small blue rectangles on the chart and this level seems like a magnet for price.
It is left to the US traders to pick up the momentum and push the price higher but if the price breaks the support xone the next level on the way down is 7,701 consolidation support.
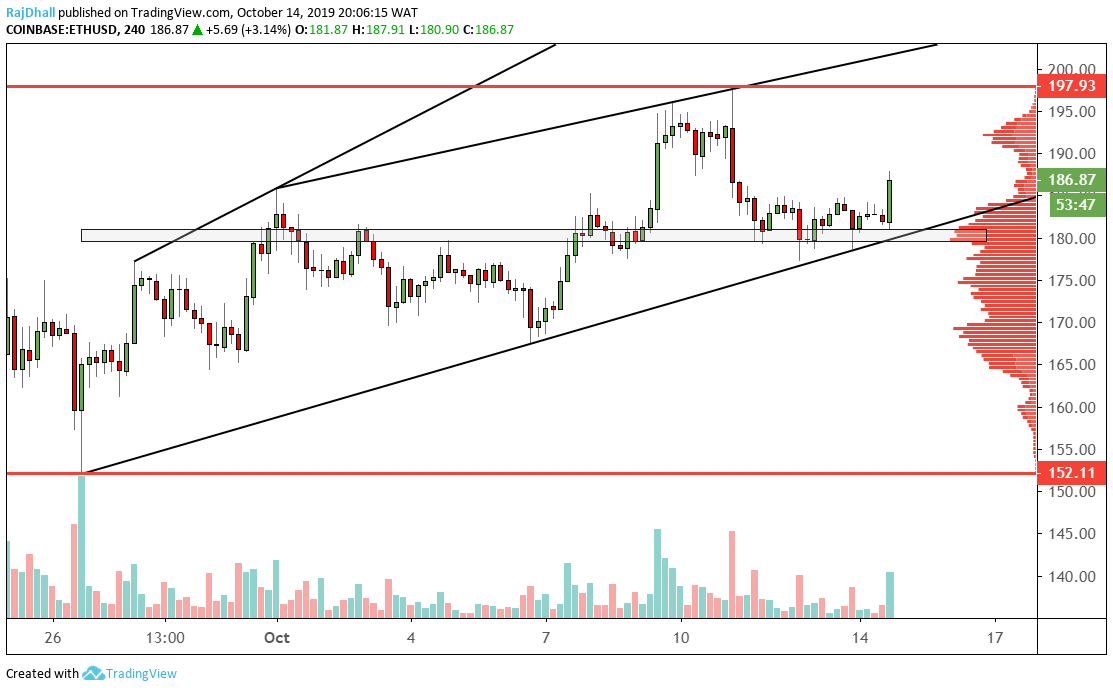
ETH/USD technical analysis: Ethereum has just bounced off a decent support level
Ethereum is performing well today and trades 3.14% higher today bouncing off the 180.00 support zone.
After the pair found support 150.00 back on 26th September 180.00 has been a pivot level ever since.
On the chart below you can also see the channel formation that has been pretty well respected, but the most encouraging sign for the bulls has been the volume on the last four-hour candle.
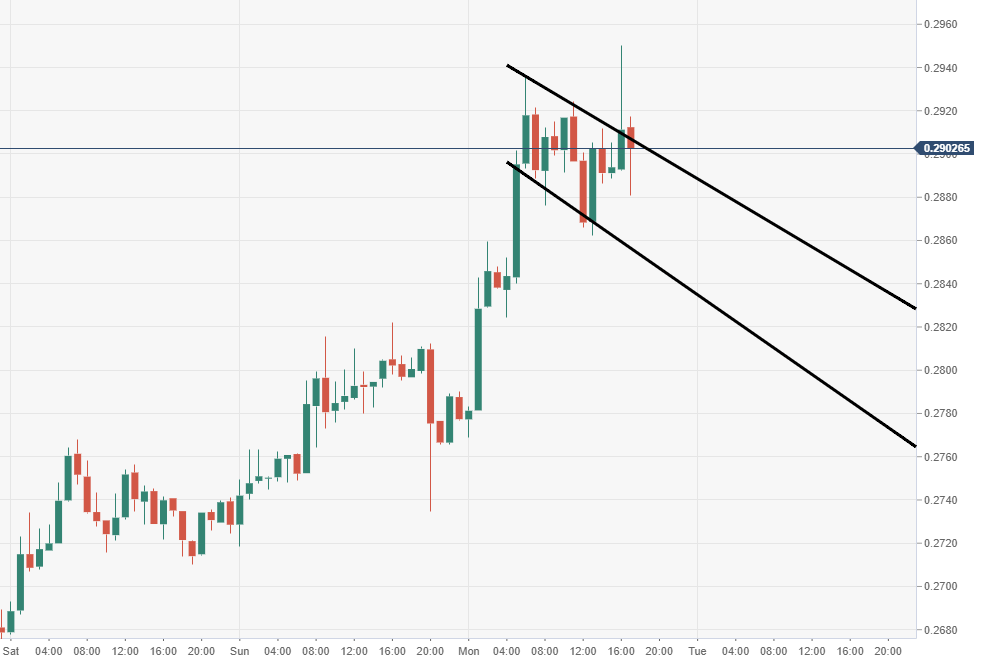
Ripple’s XRP technical analysis: XRP/USD bulls must breakdown big barrier at $0.3000 for greater heights
Ripple’s XRP price is trading with gains of some 4.50% in the session on Monday.
XRP/USD bulls have to find another push to breakdown the heavy supply at $0.3000.
Price action can be seen moving within an ascending channel structure, which could be also viewed as a bearish flag.