BTC/USD technical analysis: Bulls stopped in their tracks just ahead of 8,350
The Bitcoin bulls seemed to be in control today as earlier on BTC/USD traded higher after rejecting lower levels on Sunday.
Now the psychological 8K level will come back into focus as the four-hour shooting star candle could indicate some further pain for Bitcoin.
It is interesting how the volume profile indicator (right-hand side) peak keeps acting like a price magnet. Although, in consolidation phases, this is often the case.
If BTC/USD makes a higher low and take out the 8,252 level it would be a bullish sign and that idea could still play out.

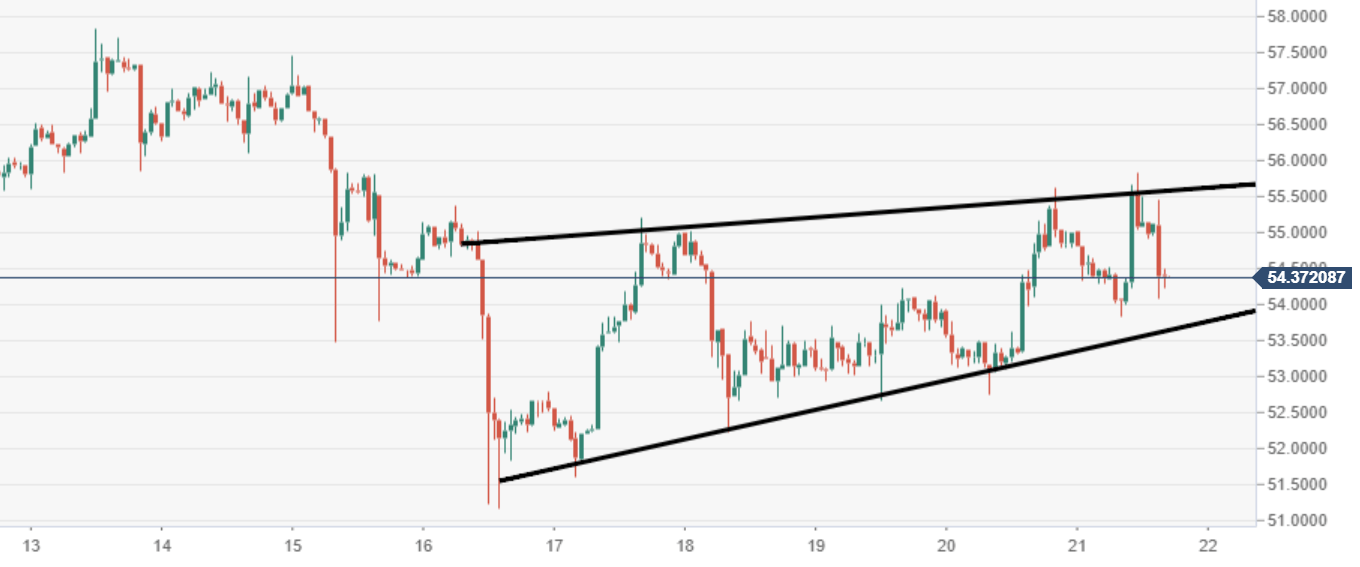
Litecoin technical analysis: LTC/USD is stuck underneath bearish flag structure
Litecoin price is trading in the red in the session by some 1.10%.
LTC/USD remains very much vulnerable to downside risks as it sits below the breached bear flag.
Daily resistance should be noted at $55, where the lower acting trend line of flag is tracking.
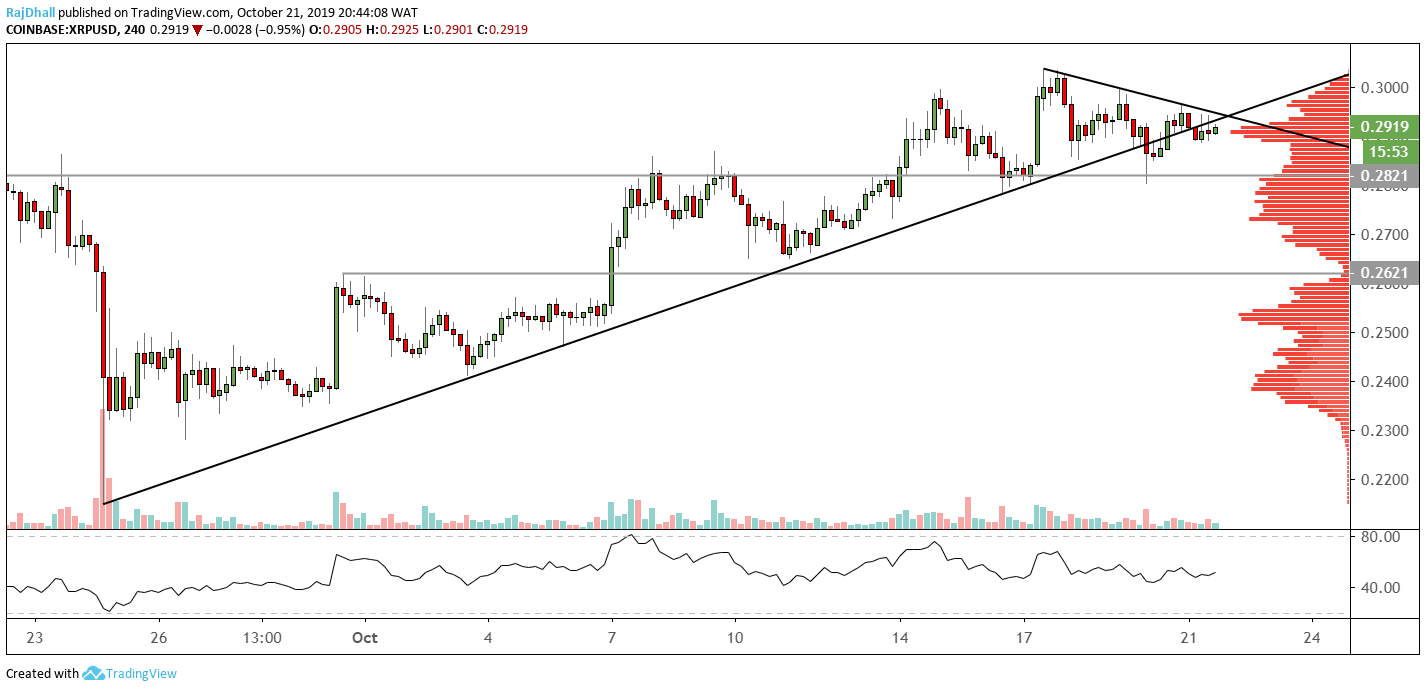
XRP/USD technical analysis: We are about to see if XRP has run out of momentum
XRP/USD has been one of the darlings of the crypto market over the last few weeks rising 9.42% since 24th September.
The 0.3000 resistance level is proving to be a tough nut to crack for the bulls and if the XRP/USD is to push higher it needs to break the psychological level,
The relative strength index (RSI) is showing signs of a momentum drop off as the price made high highs the indicator made lower highs.
At the moment, on the four-hour chart, the candlesticks are showing signs of indecision as they are forming Doji candles.