Bitcoin price analysis: BTC/USD finds support at the SMA 200 curve
The BTC/USD daily chart is trending in a narrow $400 range between $9,550 and $9,150. Bitcoin managed to chart two bearish days in a row. So far today, BTC/USD fell from $9,203 to $9,182.

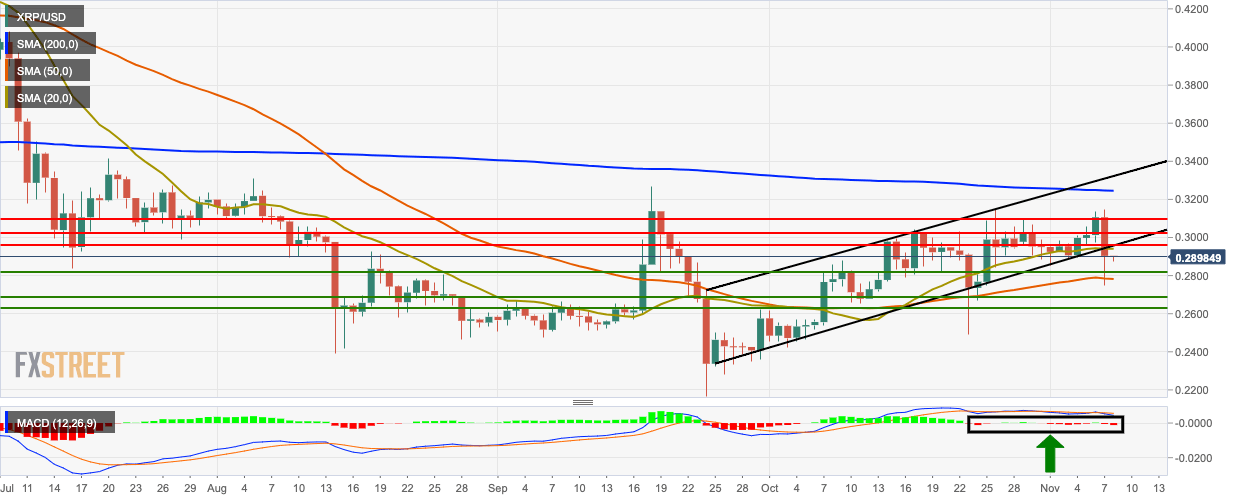
Ripple technical analysis: XRP/USD drops below the upward channel formation
XRP/USD went down from $0.2905 to $0.289 so far this Friday. After dropping below the $0.30-zone and the upward channel formation this Thursday, the bears have remained in control. The Moving Average Convergence/Divergence (MACD) indicates sustained bearish sentiment.
Litecoin price analysis: LTC/USD re-embarks on another mission targeting $70
Litecoin has in the last few days defiantly stayed above $60. The immediate upside is also acutely limited at $64. On the downside, several support areas have been instrumental including the ascending trendline, the 50 Simple Moving Average (SMA) on the 4-hour chart and the 100 SMA at $58.