- Bitcoin price movements are influenced by the US stock market momentum
- BTC and major altcoins stay in red ahead of the US opening.
A popular cryptocurrency analyst and an author of S2F Bitcoin price model know on Twitter under the nickname PlanB admitted that Bitcoin’s recent price movements correlated to the US stock market momentum
Bitcoin is down, and so is S&P500 .. “U.S. Stocks Tumble With Virus Threatening Economy”. Just like June 11 and just like the month March. This has nothing to do with “Whales”, “futures manipulation”, “Plustoken scammers” etc etc.
This opinion is supported by the recent price developments, even though it is at par with a popular belief that Bitcoin is a safe-haven asset. While Bitcoin’s correlation with the traditional assets is often inconsistent, it tends to go down amid massive flight to safety.
Top-3 coins overview
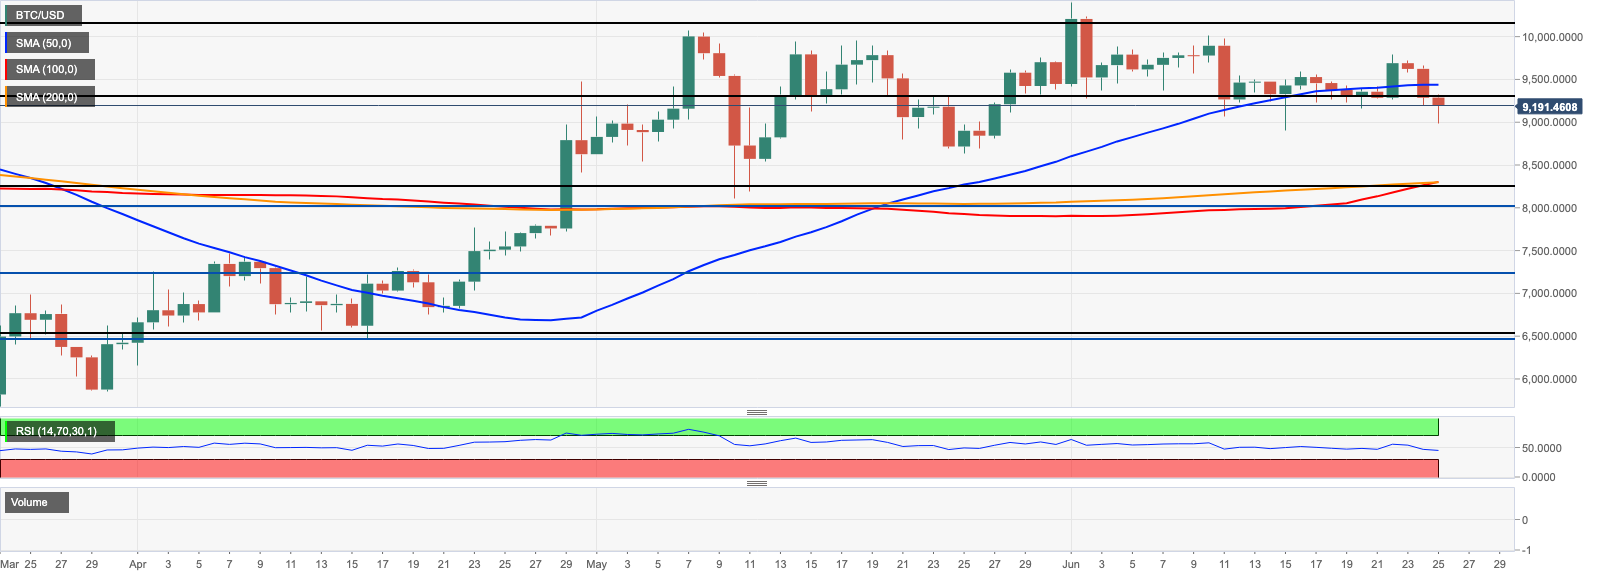
BTC/USD touched the area below $9,000 during early Asian hours; however, all moves below this critical level is heavily bought at this stage. At the time of writing, BTC/USD is changing hands at $9,280, mostly unchanged since the start of the day. The coin may be vulnerable to sharp market movements ahead on the options and futures settlement on Friday. The local resistance is created by daily SMA50 on approach to $9,500.
BTC/USD daily chart
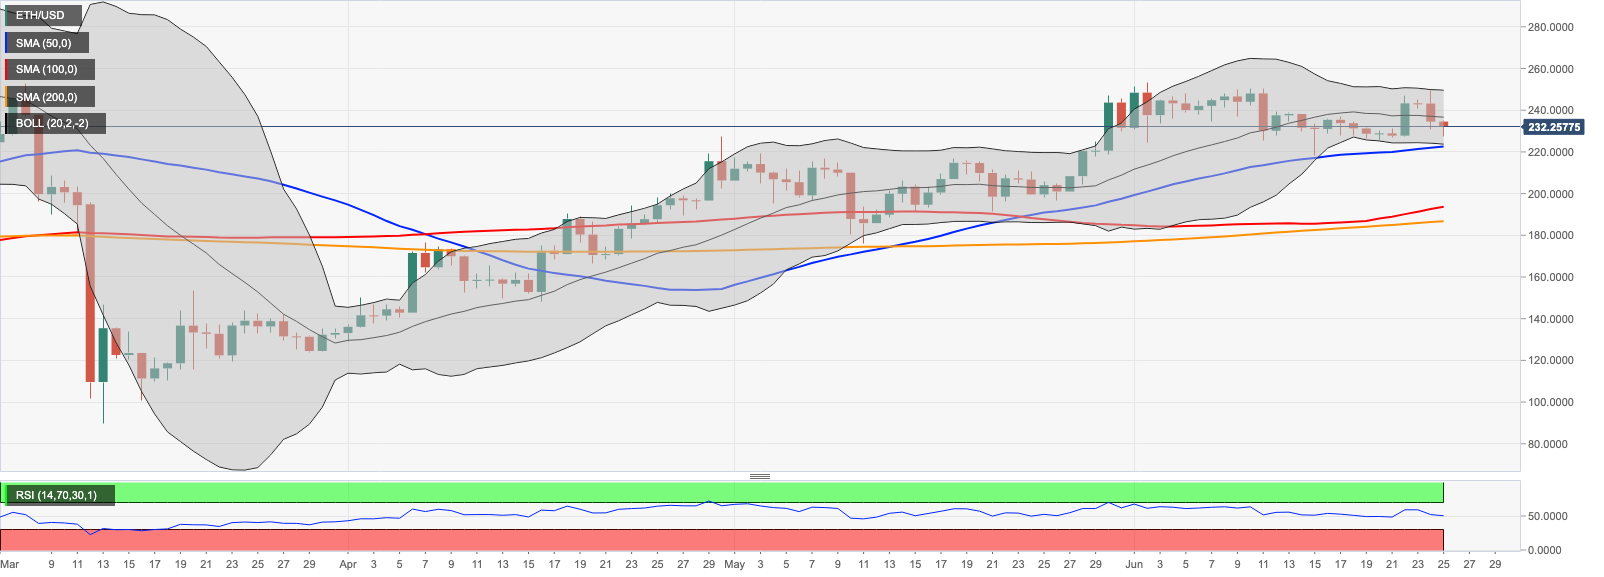
ETH/USD settled at $232.60 having recovered from the intraday low of $227.26. The coin is moving within the narrow channel with the with support created daily SMA50 and the lower line of the Bollinger Band at $222.50. The resistance comes at the recent high of $253.67. A sustainable move above this area is needed for the upside to gain traction.
ETH/USD daily chart
XRP/USD is still below $0.1900 despite the cryptocurrency recovery across the board. The coin has stayed mostly unchanged both since the start of the day and on a day-to-day basis, however the short-term bias is bearish. The critical resistance is created by a combination of daily SMA100 and the middle line of the daily Bollinger Band at $0.1930. The support comes at the recent low of $0.1785, followed by the psychological $0.1700.
XRP/USD daily chart

-637286901485752207.png)
