- ETH/BTC bulls took control after four straight bearish days.
- The Fear and Greed Index has gone up from 40 to 42 as price remains in Fear zone.
Bitcoin Fear and Greed Index
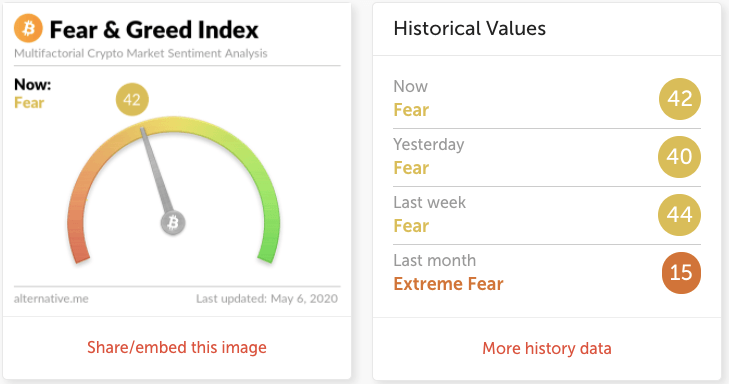
Alternative.me’s Fear and Greed index has gone up a bit from 40 to 42. The price is still in the “Fear” zone, indicating that the market still undervalues the asset.
ETH/BTC daily chart
-637243290258173143.png)
ETH/BTC bulls have finally gained an advantage following four straight bearish days, going up from 0.02273 to 0.02275. This Tuesday, the bears took ETH/BTC below the 20-day Bollinger Band, indicating that it was undervalued and would face bullish correction soon. Presently, the bulls have managed to take the price back into the Band. The price is still trending in a downward channel formation, while the Elliott Oscillator has had 10 straight red sessions.
The bulls face strong resistance at SMA 50, 0.023, downward trending line and 0.0235. On the downside, healthy support levels lie at 0.0225, downward trending line and 0.0221.
BTC/USD daily chart
-637243290960473898.png)
BTC/USD has dropped from $9,032.28 to $8,997 in the early hours of Wednesday. The price is still consolidating below the red Ichimoku cloud and has found support at the upward trending line. The SMA 20 is about to cross over with the SMA 200 to chart a bullish cross pattern. The RSI is about to drop from the overbought zone, while the MACD shows decreasing bullish momentum. The price has two strong resistance levels at $9,624.70 and $9,170.
ETH/USD daily chart
-637243292380013650.png)
After failing at the $213.93 resistance level this Saturday, ETH/USD has had four straight bearish days and is trending in a downward channel formation. The price has fallen from $205.46 to $204.60 in the early hours of Wednesday. Over the last four days, the RSI has dropped from the edge of the overbought zone to 62.50.
The daily chart has two resistance levels on the upside at $213.93 and $223.64. On the downside, the bulls must defend key support levels at $197.13, SMA 20 and $188.15 to prevent further downward momentum.
XRP/USD daily chart
-637243292973975874.png)
The XRP/USD daily chart is hovering below the triangle formation and the downward trending line. The price has dipped from $0.217 to $0.2167 and has is currently negotiating with resistance at the downward trending line. The MACD shows decreasing bullish momentum and the Elliott Oscillator has had four straight red sessions. On the upside, there are two strong resistance levels at $0.223 and $0.233. Two healthy levels support the price at $0.2022 and $0.189.
