- ETC/USD bulls bounced up from support at the upward trending line.
- LINK/USD bears took control and dropped price below the triangle formation.
ETC/USD daily chart
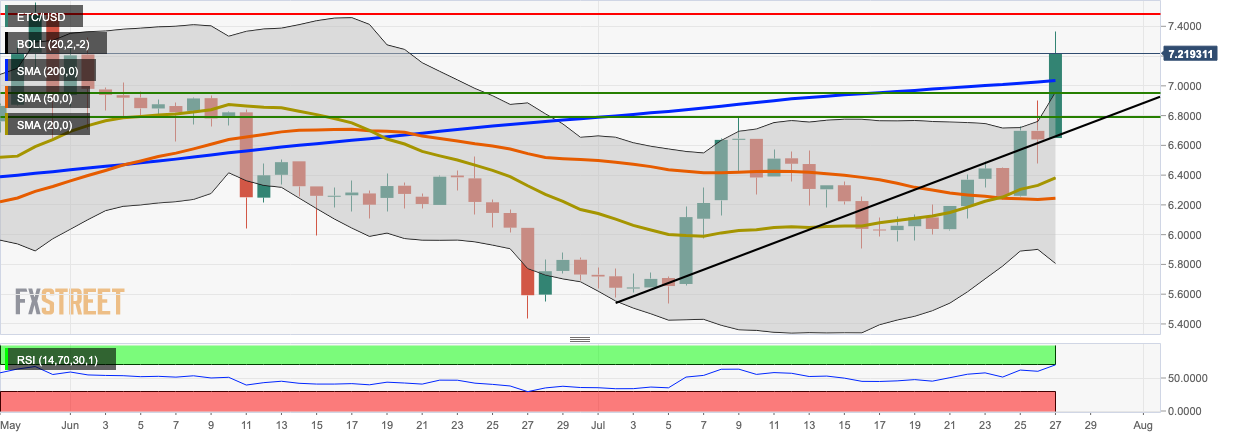
ETC/USD bulls bounced up from the support at the upward trending line to take the price from $6.65 to $7.16. In the process, the price has broken above the SMA 200 and the upper curve of the 20-day Bollinger Band. The RSI has dipped into the overbought zone, showing that the price is currently overvalued. On the upside, the price has strong resistance at $6.95, $7.04 (SMA 200) and $7.50.
LINK/USD daily chart
Unfortunately, LINK/USD has suffered the opposite fate, with the bears coming in and dropping the price below the triangle formation. The price has fallen from $7.50 to $7.13, breaking below the SMA 20, in the process. The MACD shows increasing bearish momentum. The support levels at $6.48 and $6.12.
