- Bitcoin Fear and Greed index shows that the asset in the Fear zone and is trending around the 40-level.
- The MACD in the ETH/BTC chart shows increasing bullish momentum.
Bitcoin Fear and Greed index
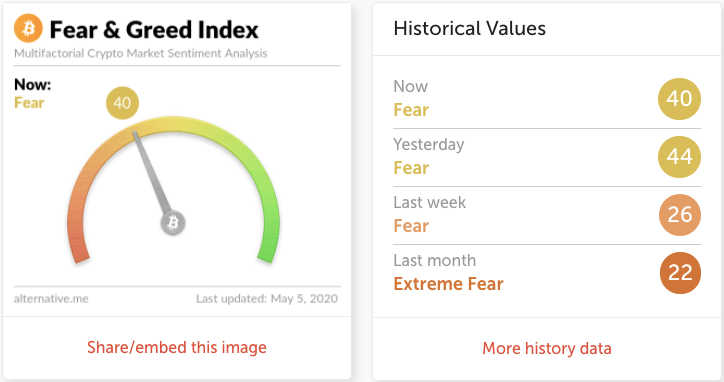
Alternative.me’s Fear and Greed Index has dropped from 44 to 40 as Bitcoin remained in the “Fear” zone. This shows that Bitcoin is currently undervalued and may pick up momentum soon.
ETH/BTC daily chart
-637242443911111430.png)
ETH/BTC is trending in a downward channel formation as it went down from 0.02327 to 0.02325 in the early hours of Tuesday. The MACD indicates increasing bearish momentum, while the Elliott Oscillator has had nine straight red sessions, going down from 0.002436 to -0.000259. On the upside, there are two resistance levels to overcome at 0.0248 and 0.0239. On the downside, there are two healthy support levels at 0.0229 and 0.0221.
BTC/USD daily chart
-637242444215046091.png)
BTC/USD bears remained in control for the third straight day as the price dropped from $8,886 to $8,870.74. This Monday, the price broke below the upward trending line and it has moved horizontally since then. The daily BTC/USD price is consolidating below the red Ichimoku cloud. The SMA 20 is about to cross over the SMA 200, to potentially chart a bullish cross, while the Elliott Oscillator has had two red sessions following 11 consecutive green sessions. The RSI indicator is sitting on the edge of the overbought zone, which hints at a short-term bearish correction.
On the upside, there are is strong resistance at $9,012.32, which the bulls will need to overcome and enter the red cloud. Following that, there is another notable resistance at $9,162. Ont he downside, there are two healthy support levels at $8,796 and $8,363.25.
ETH/USD daily chart
-637242442578636083.png)
After having failed at the $214.59 resistance level, ETH/USD has had three consecutive bearish days. So far this Tuesday, the price of the asset dropped from $206.83 to $205.65. The price has broken below the upward trending line, while the 20-day Bollinger Jaw is narrowing to indicate decreasing price volatility. The SMA 50 is on course to cross over the SMA 200, to chart a potential golden cross. The Elliott Oscillator has had two straight red sessions.
The bulls will need to overcome two strong resistance levels at $215.15 and $224.70. If the buyers overcome the latter, they will be able to cross above the 20-day Bollinger Band. On the downside, there are two healthy support levels at $200.54 and $188.75.
XRP/USD daily chart
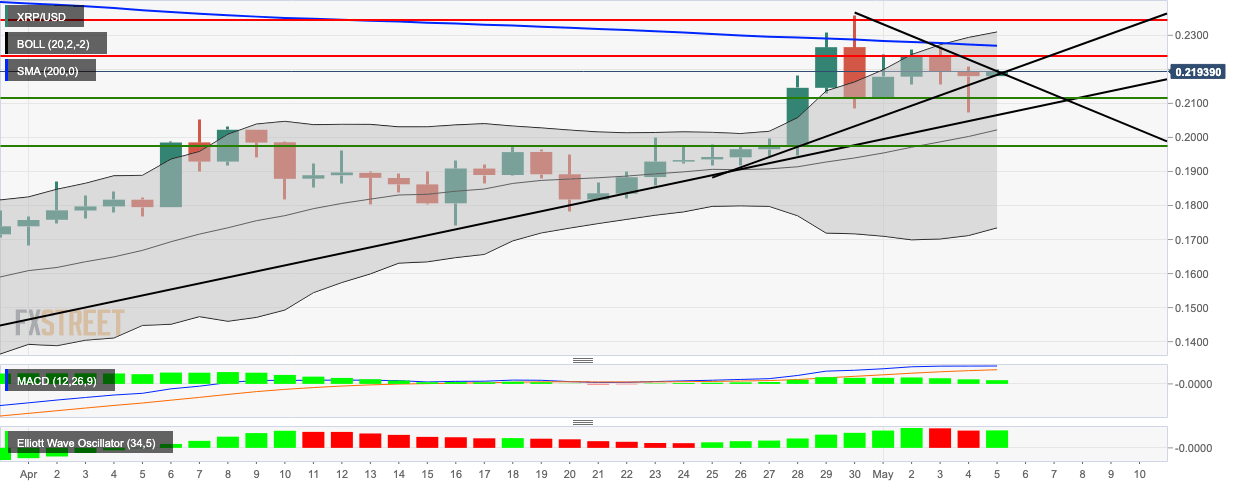
XRP/USD is consolidating in a triangle formation as the bulls started the day strong, going up from $0.218 to $0.2182. The MACD indicates decreasing bullish momentum, while the Elliott Oscillator has had a green session following two red sessions. On the upside, the buyers need to overcome strong resistance at $0.2245, SMA 200 and $0.2348. The price is ably supported at $0.2116 and $0.1978.
