- Dash price is currently contained inside a parallel channel on the 12-hour chart.
- Dash bulls face a strong resistance level that could be the key for a 37% breakout.
Dash has been trading somewhat sideways for the past month and it’s awaiting a potential breakout towards $136, but needs to climb above several resistance levels first. The digital asset has formed a parallel channel on the 12-hour chart and it’s trading right in the middle.
Dash price can reach $136 if bulls can conquer this level
On the 12-hour chart, Dash price is just below the 50-SMA and 100-SMA levels which coincide at $100. This resistance point is crucial and if broken, Dash price could climb towards the top of the parallel channel at $110.
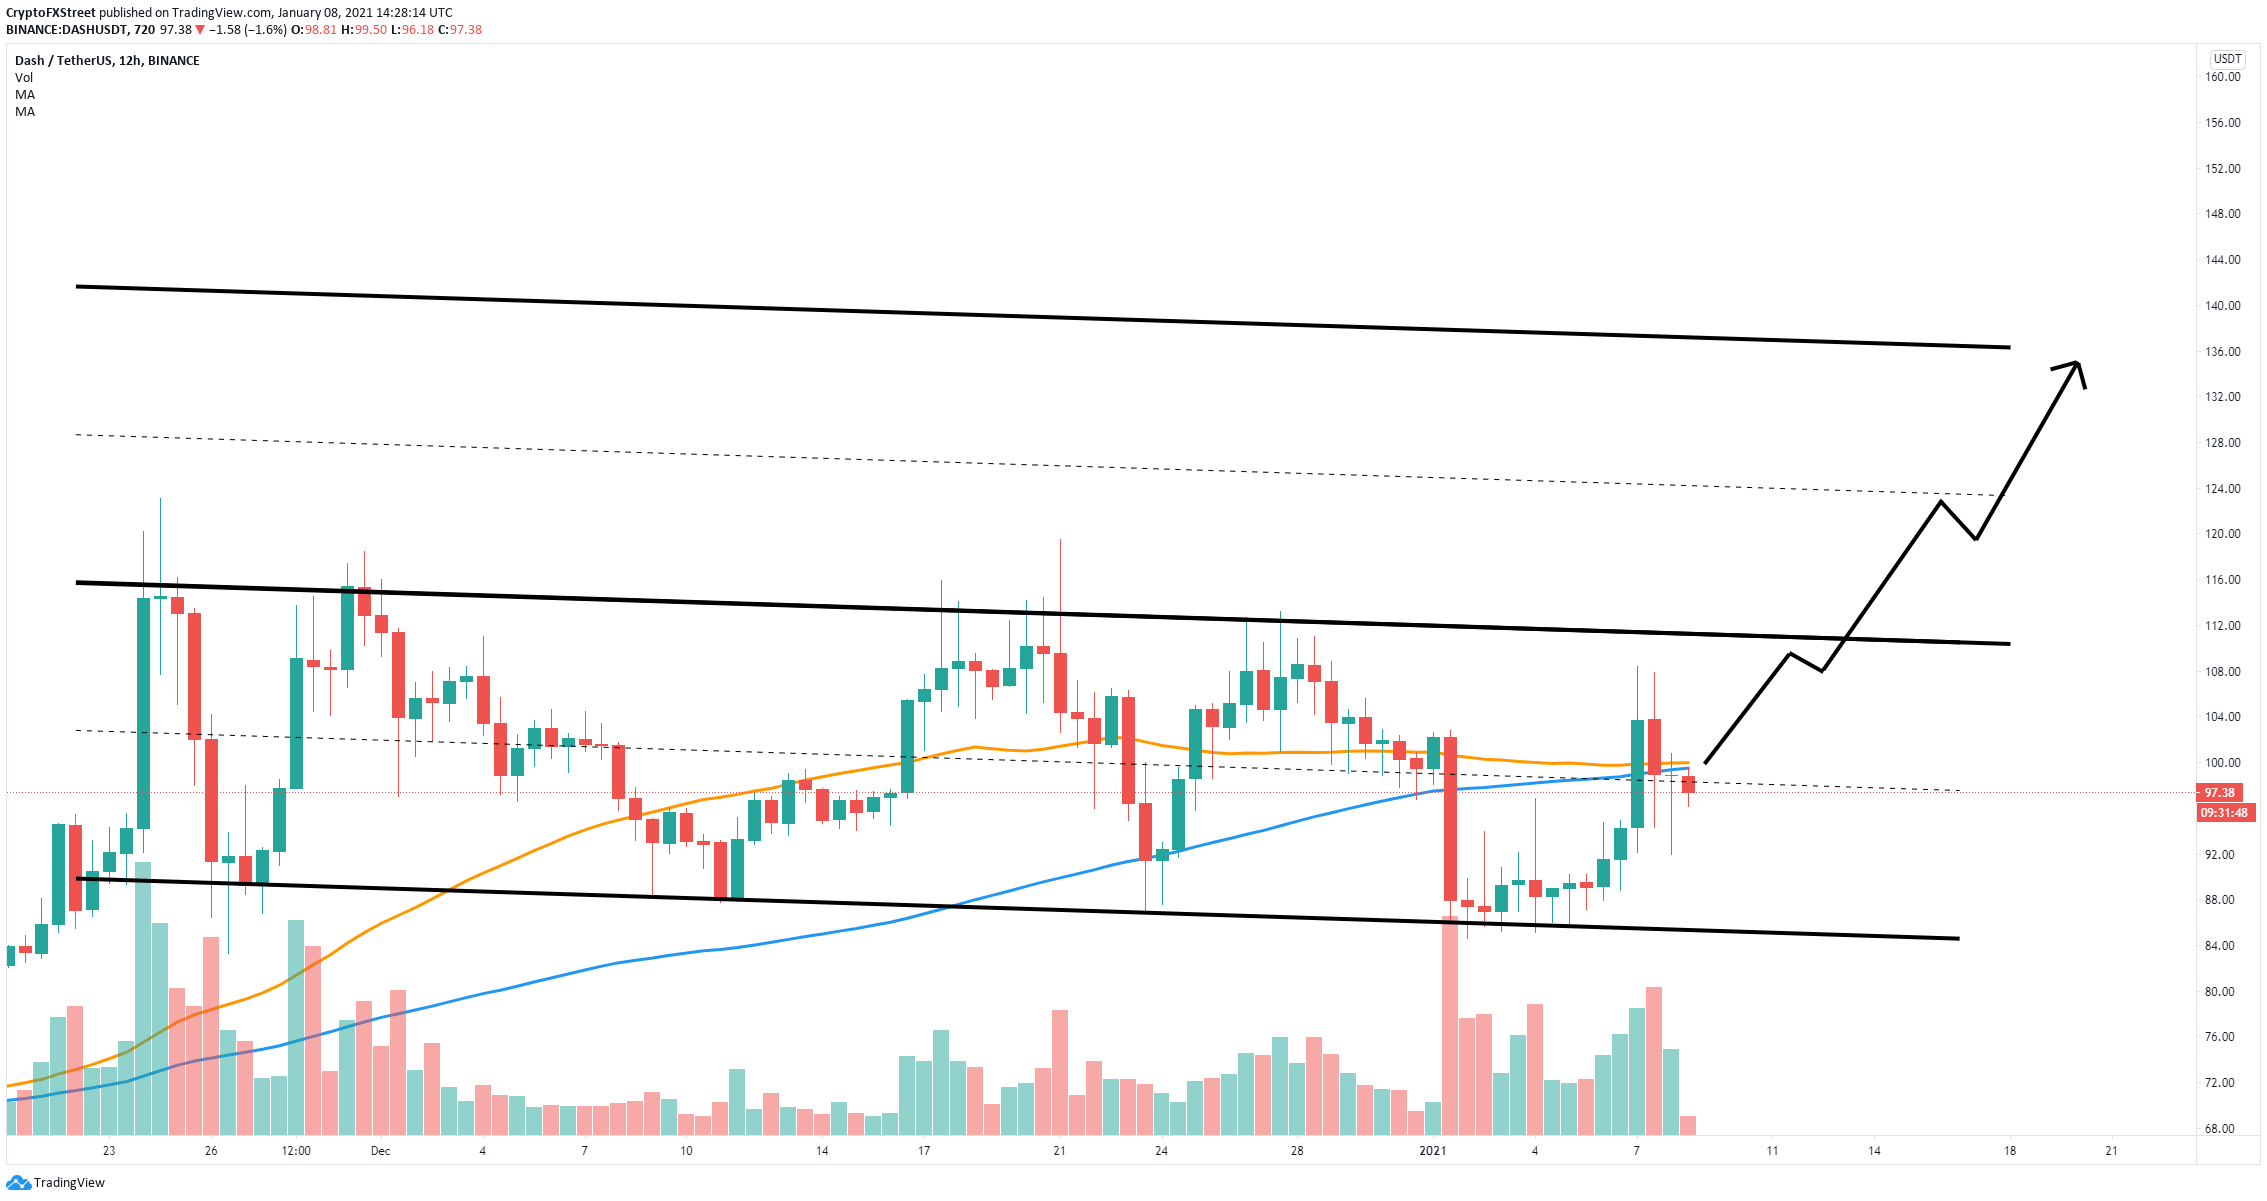
DASH/USD 12-hour chart
The resistance level at $110 is the final step before a breakout towards $136. The initial breakout would push Dash to $123 before a small correction and a final push to $136.
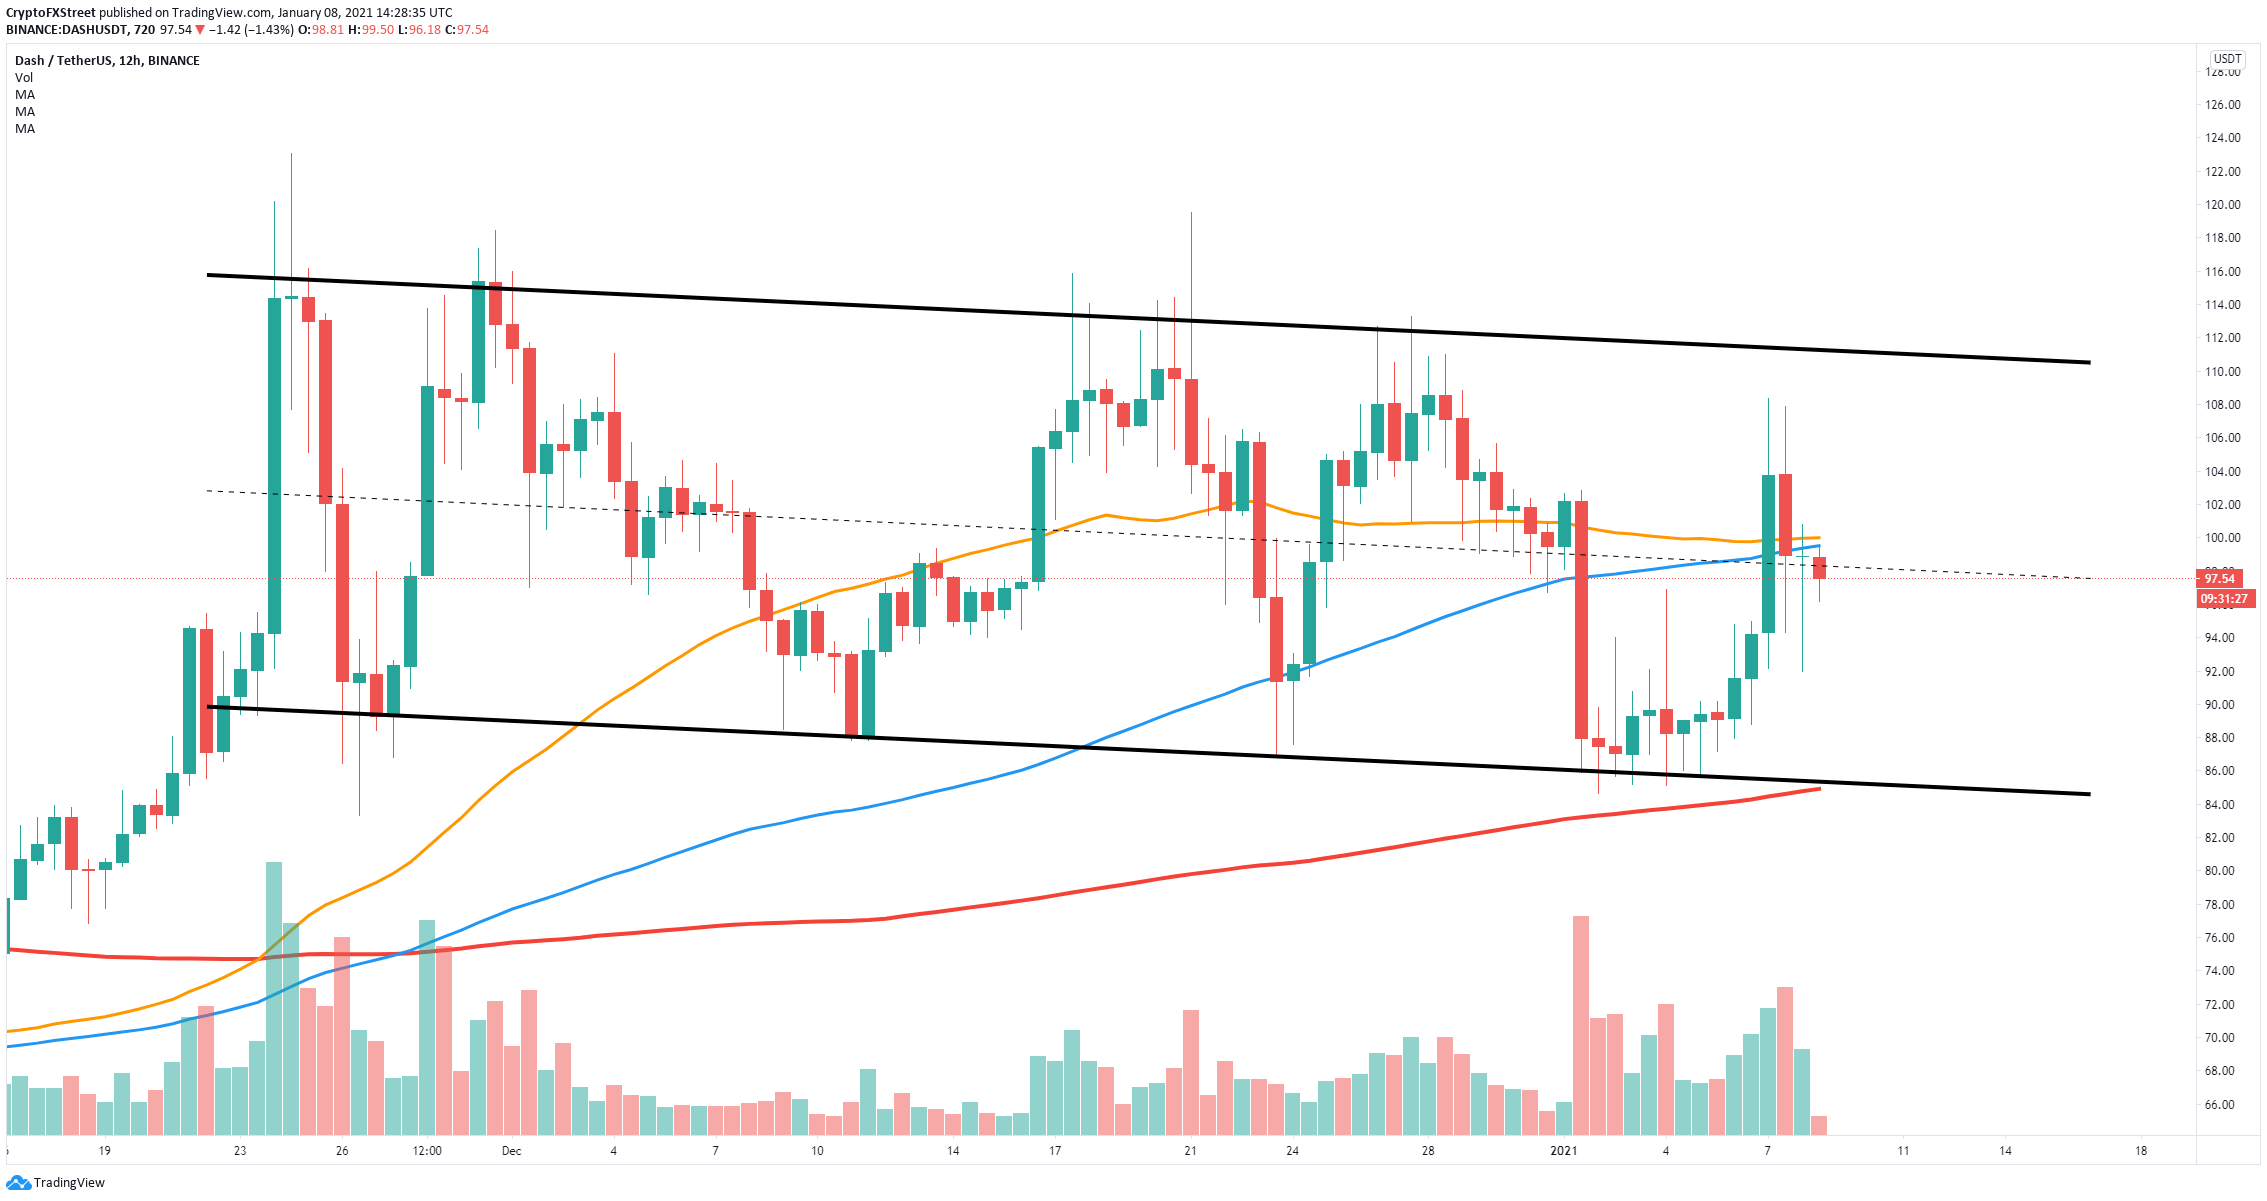
DASH/USD 12-hour chart
However, Dash price is still below the 50-SMA and 100-SMA and might get rejected from $100. This rejection can quickly push the digital asset down to $85 which is the lower boundary of the parallel channel and the 200-SMA.
