- DASH/USD is hovering above the SMA 20 and SMA 50 curves in the daily chart.
- The MACD indicator shows increasing bullish momentum.
DASH/USD daily chart
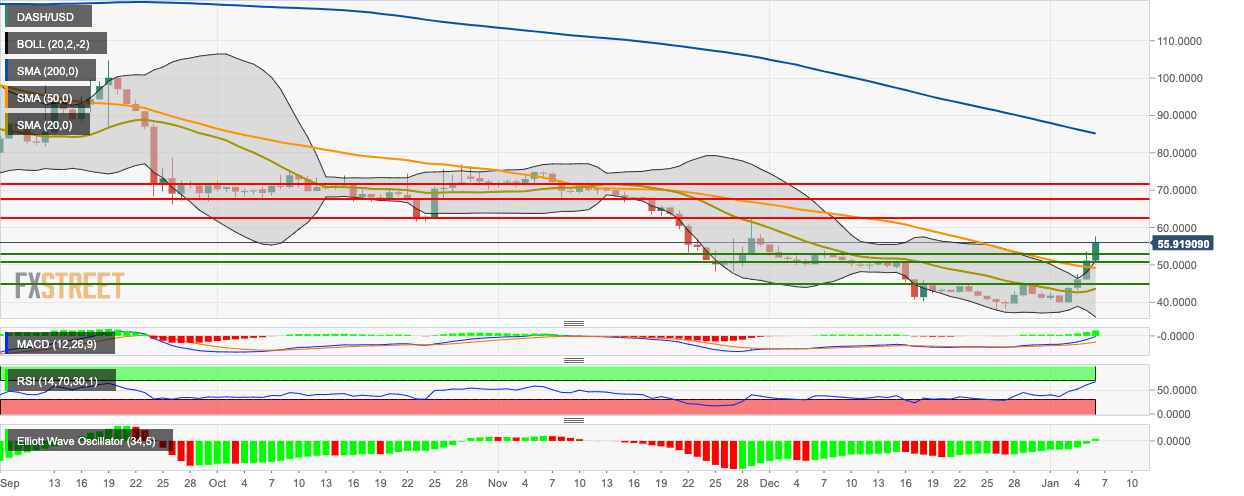
DASH/USD bulls have remained in control for the fourth straight day, taking the price from $51.25 to $56. In this four-day period, the price has jumped by 39.45%. The 20-day Bollinger jaw has widened, indicating increasing price volatility. The price is hovering above the 50-day Simple Moving Average (SMA 50) curve and 20-day Bollinger Band.
The Elliott Oscillator and the Moving Average Convergence/Divergence both indicate increasing bullish sentiment. The Relative Strength Index (RSI) indicator is trending around 67.25, right next to the overbought zone, hinting that the price may go up even more before experiencing a bearish correction.
