- DASH/USD has jumped above the 20-day Bollinger Band, indicating that the price is overvalued.
- The RSI is on its way into the overbought zone.
DASH/USD daily chart
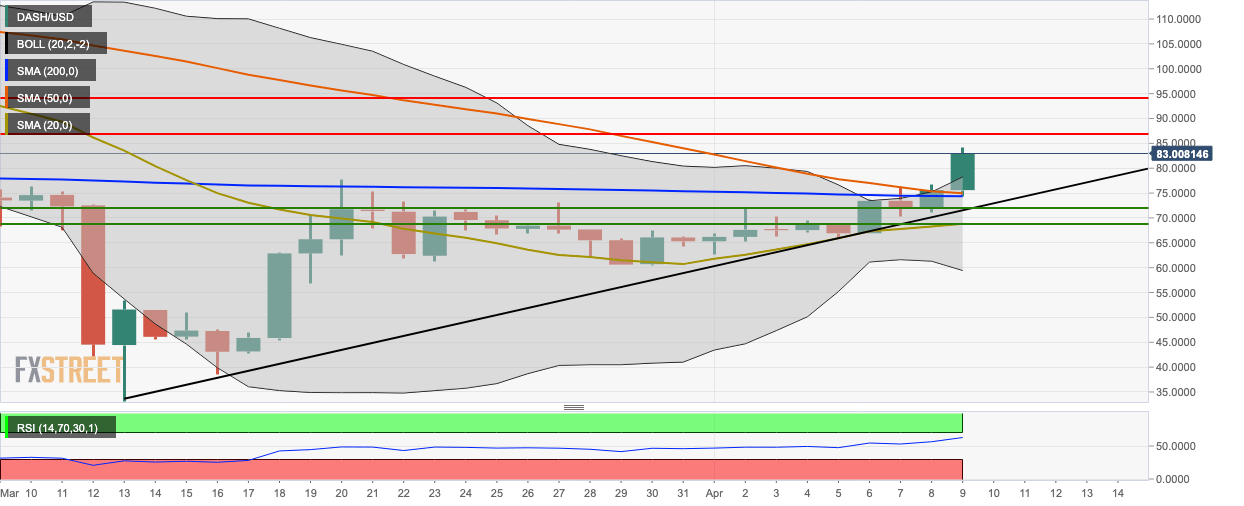
DASH/USD bulls stayed in charge as this Thursday’s sessions came to a close. The price rose by nearly 9% as it jumped from $76 to $82.82, breaking above the SMA 50 and SMA 200, in the process. The price has also climbed above the 20-day Bollinger Band, indicating that the asset is currently overpriced and may soon face bearish correction. The 20-day Bollinger jaw has widened as well, which shows increasing market volatility. The RSI is trending around 64 and is well on its way into the overbought zone. Before this Thursday’s bullish price action, the SMA 200 was about to cross over the SMA 50 to chart the bearish death cross pattern, but the two have since diverged from each other.
Key levels
