- The MACD indicator shows that the market momentum is on the verge of bearish reversal.
- The RSI indicator has jumped out of the oversold territory.
DASH/USD daily chart
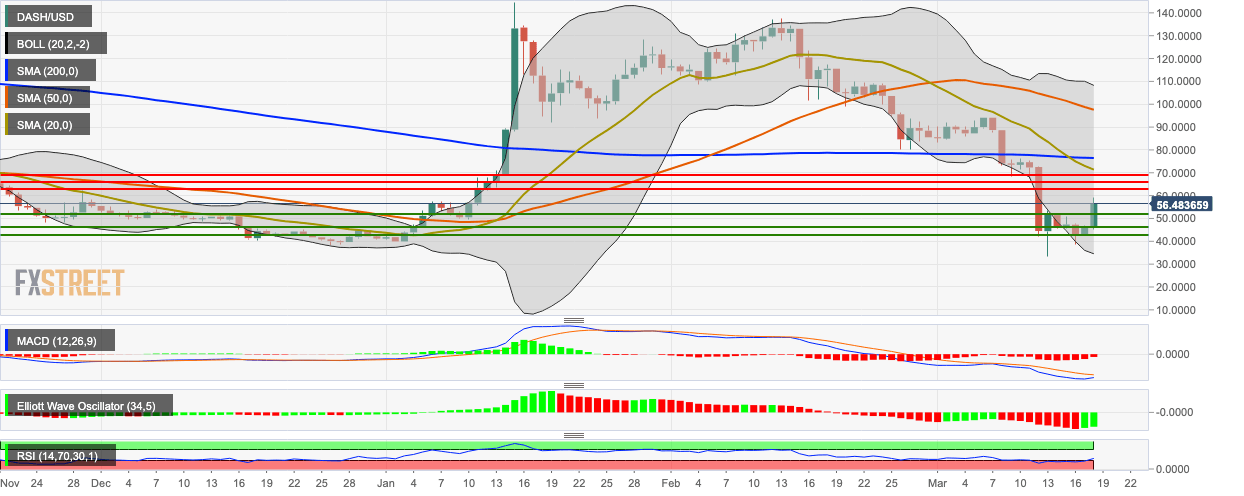
As the rest of the coins continues to move sluggishly, DASH/USD completely defied market expectations and flew up from $45.85 to $55.78 this Wednesday. However, it doesn’t look like any solid fundamentals back this sudden surge, so it could be a bull trap. DASH/USD is currently sandwiched between the lower curve of the 20-day Bollinger Band on the downside and the SMA 20, SMA 50 and SMA 200 curves on the upside.
The signal line is going to cross over the MACD line, which indicates a potential reversal of bearish momentum. At the same time, the Elliott Oscillator has had two straight green sessions following ten consecutive red sessions and the RSI indicator has jumped out of the oversold zone following bullish price action.
