- DASH is currently trading at $68.36 after defending a critical support level at $66.5.
- The TD Sequential indicator is showing several buy signals on various time-frames.
DASH has lost 36% of its value since its peak on August 6 at $104.8. The digital asset is currently trying to bounce back up with the help of various indicators which are showing a shift in momentum for the bulls.
DASH/USD daily chart
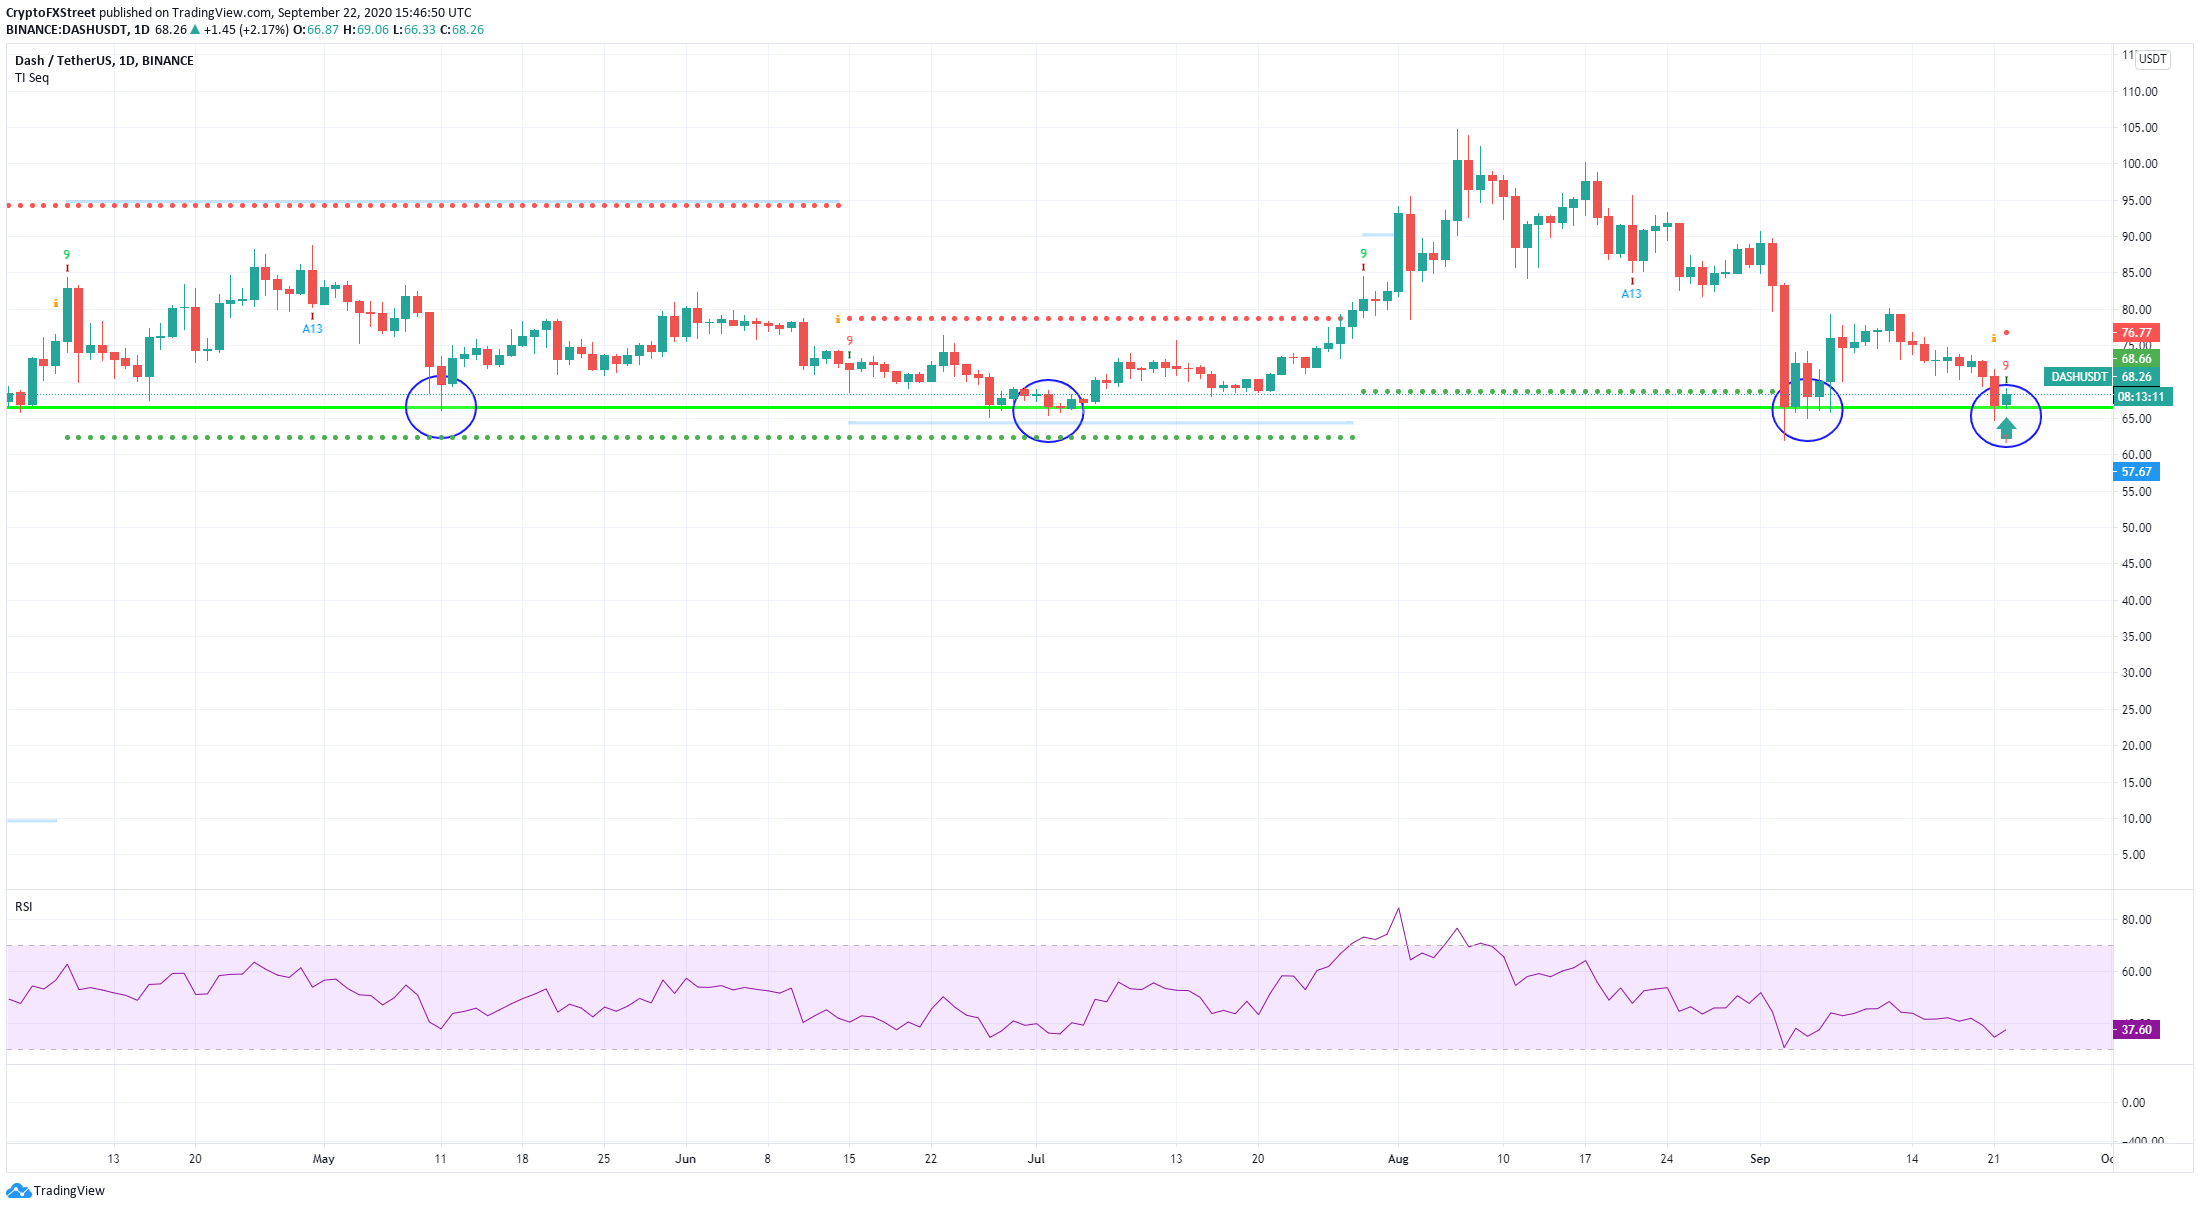
The TD sequential indicator has presented a buy signal on the daily chart at around $68 right after DASH defended a critical support level at $66.5 formed on May 11 and defended on several occasions through June and September.
DASH IOMAP Chart
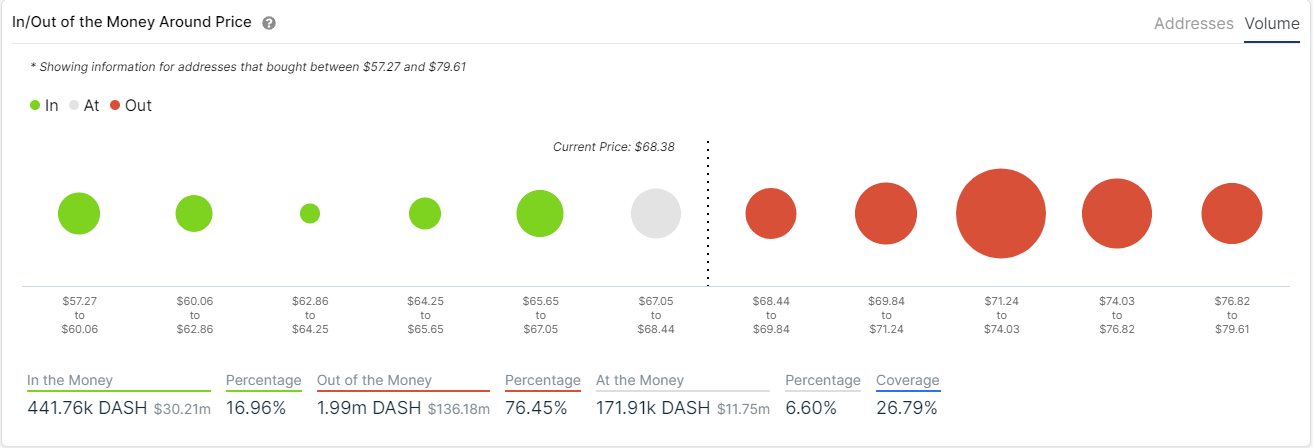
The In/Out of the Money Around Price indicator by IntoTheBlock shows a good amount of support at $68 and $66.55, right where the trendline is formed. The IOMAP chart basically identifies how many DASH coins were bought at a specific price.
DASH/USD 12-hour chart
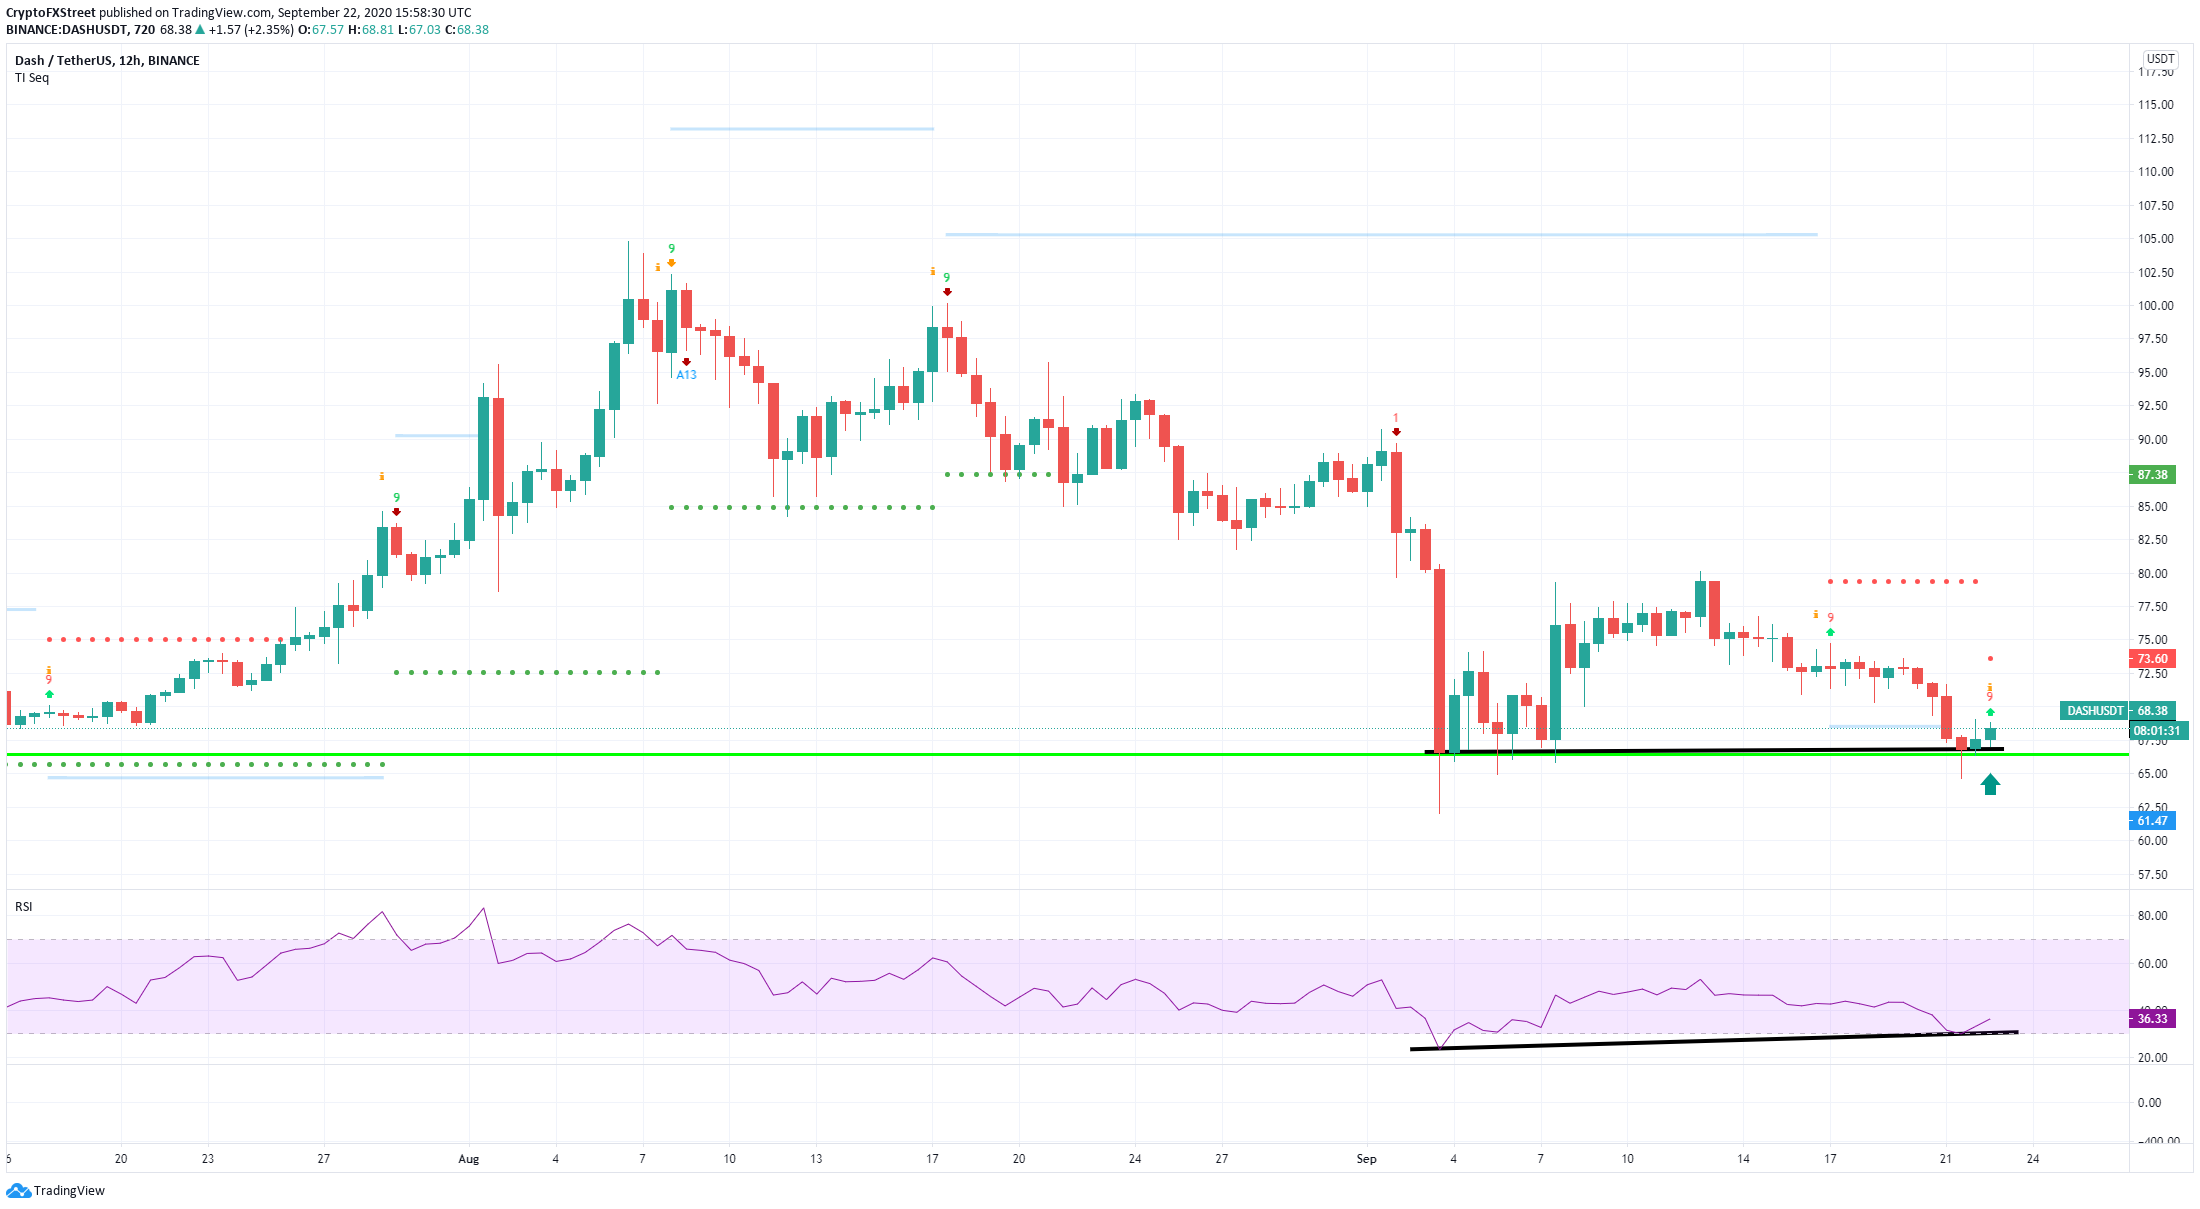
Similarly, on the 12-hour chart, the TD indicator has presented a buy signal just hours ago while the RSI was close to creating a bullish divergence but the price of DASH didn’t create lower lows but rather defended the same price point at $66.5.
DASH IOMAP Chart
Although the IOMAP chart confirms that there are a lot of buyers at $66.5 it also shows stiff resistance ahead at $69, $70, and most notably at $72 with a total volume of 796,000 DASH. For comparison, the $66.5 support level only has around 147,000 DASH in volume which means there are five times more buyers at $72.
Investors need to be on alert for a bearish breakout of $66.5 as this would most likely push DASH to lower lows close to $60. On the other hand, if both TD buy signals are correct, we could see the digital asset climb above $70 to test the massive resistance level at $72.
