- DASH/USD bulls take over the market as the price sees a jump by 4% from $80.50 to $84.
- Bulls have the chance to break past resistance at $87.50 which has not been breached in over a month.
DASH/USD bulls have taken over the market as the price sees a jump by 4% from $80.50 to $84. If the uptrend continues, then DASH/USD can break past resistance at $87.50 which has not been breached in over a month.
DASH/USD daily chart
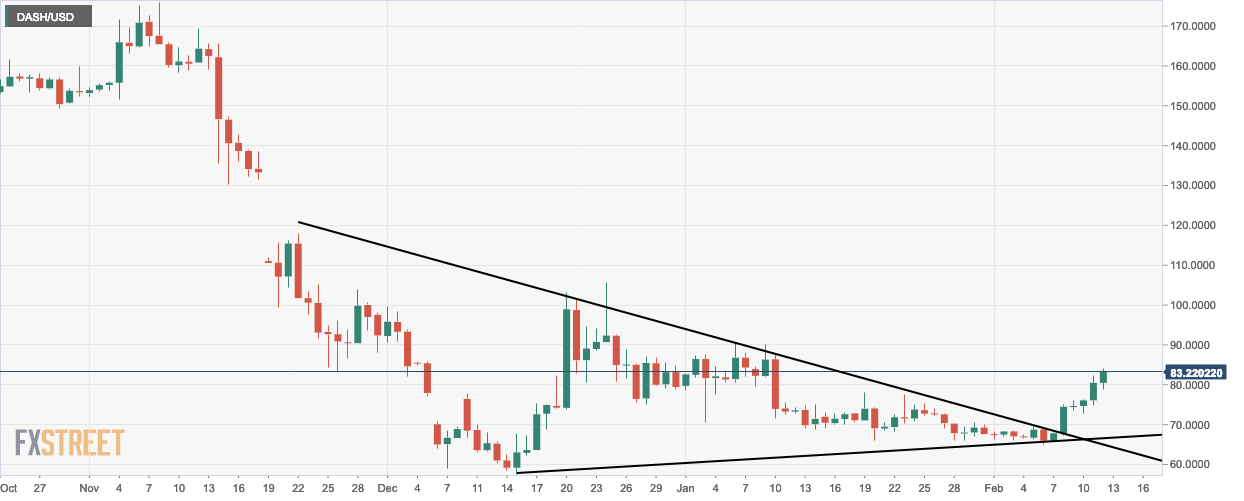
- Daily chart sees a bullish breakout from the triangle formation.
DASH/USD 4-hour chart
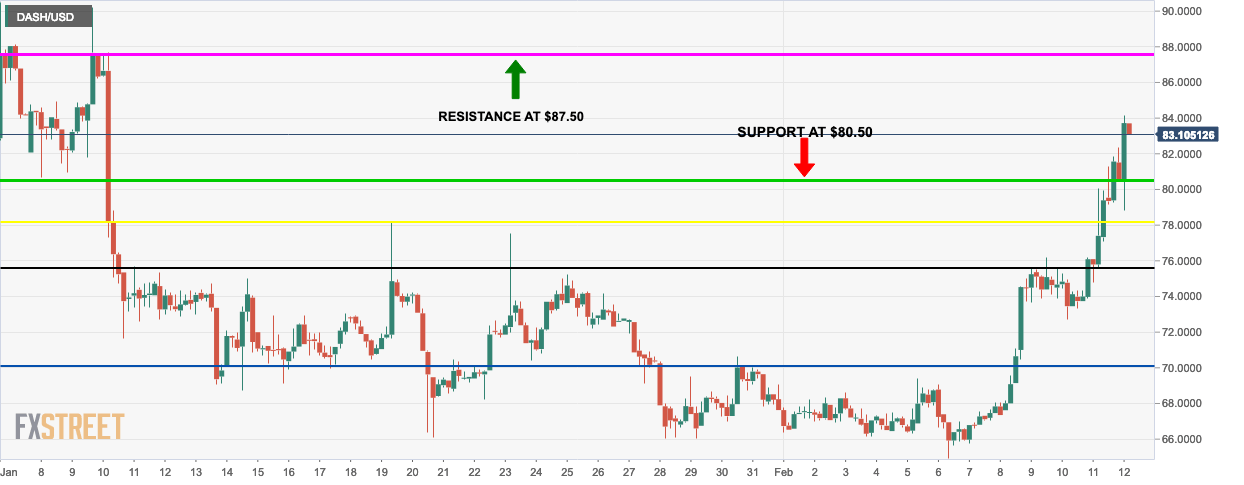
- Bulls breached past $80.50 resistance and carried enough momentum to move towards the $87.50 resistance line.
- The bears took over in the last session and stalled the upward momentum.
DASH/USD hourly chart
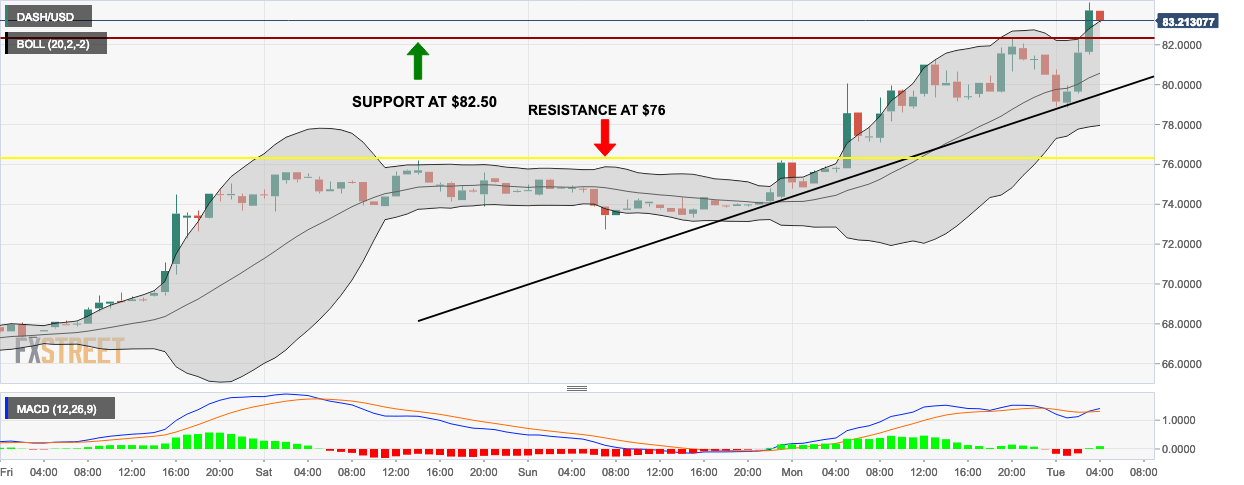
- The last two sessions are floating above the 20-day Bollinger band which shows a bullish market despite the previous session being bearish.
- The moving average convergence/divergence (MACD) indicator shows a bullish market.
Key Levels
- Resistance 3: $91.2184
- Resistance 2: $86.7976
- Resistance 1: $83.6480
- Pivot Point: $79.2272
- Support 1: $76.0776
- Support 2: $71.6568
- Support 3: $68.5072
