- DASH/USD went up from $81.10 to $81.50 in the early hours of Thursday, following a bearish Wednesday.
- The relative strength index (RSI) indicator is creeping close to the oversold zone.
DASH/USD has had a bullish start to Thursday as the price went up from $81.10 to $81.50. This Wednesday was heavily bearish for Dash as the price went down from $82.25 to $81.10. The hourly breakdown shows us that DASH/USD initially plummeted to $80.30, before bouncing up to $82.58. The price then dropped from $82.50 to $81 in just one hour, before correcting itself around $81.50.
DASH/USD daily chart
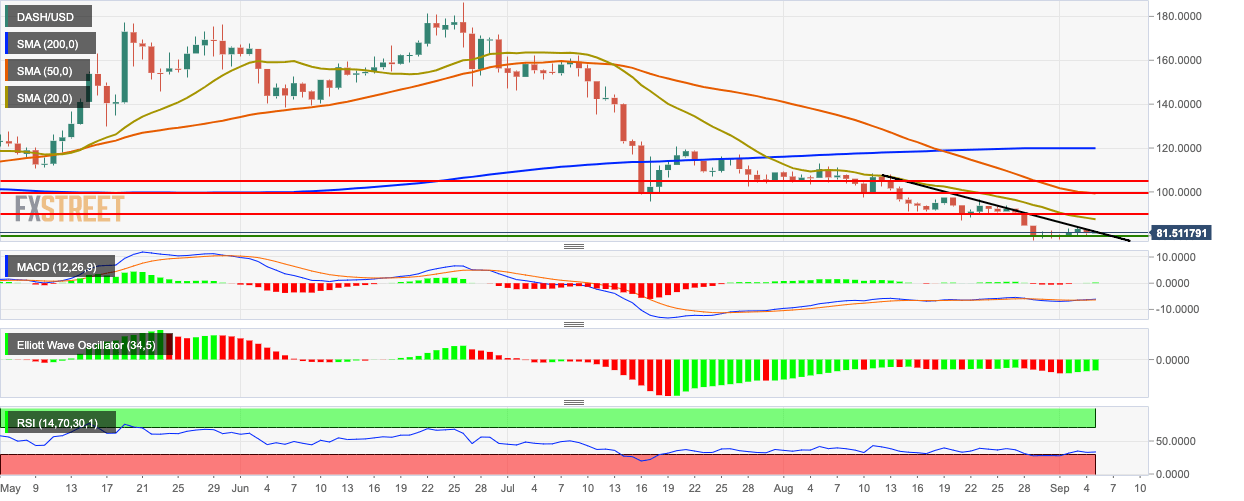
DASH/USD is currently negotiating with the resistance at the downward trending line. It is also trending below the 200-day simple moving average (SMA 200), SMA 50 and SMA 20 curves. The moving average convergence/divergence (MACD) indicator shows increasing bullish momentum and the Elliott oscillator shows three straight bullish sessions. The relative strength index (RSI) indicator is creeping close to the oversold zone.
