- DASH/USD went down from $172.15 $167.15 in the early hours of Thursday.
- Both the 4-hour and hourly DASH/USD price charts are below the SMA 200 and SMA 50 curves.
DASH/USD daily chart
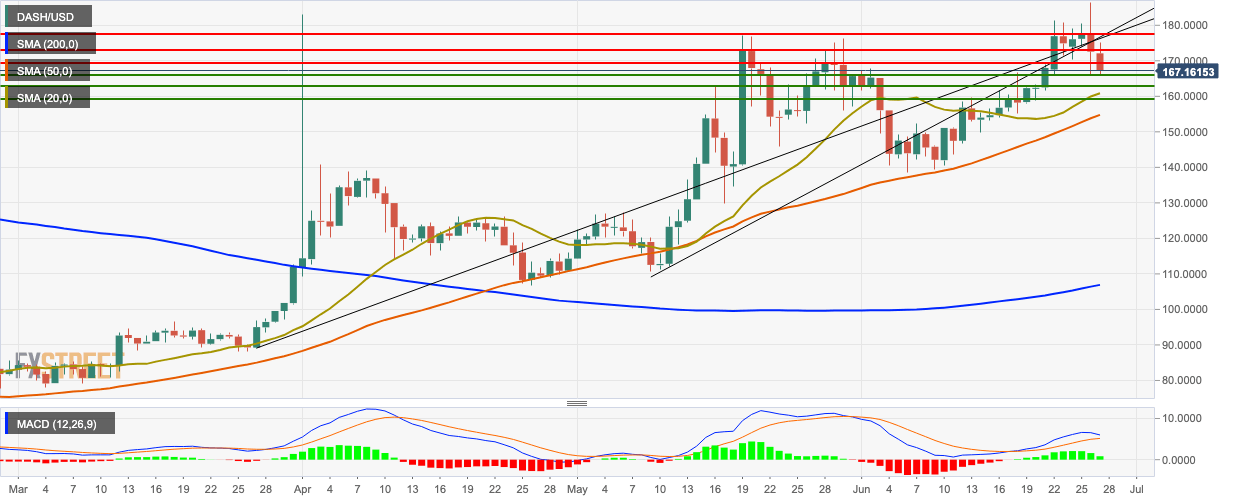
DASH/USD has had two bearish days in a row after the bulls failed at the $177.50 level. The price has subsequently gone down to $167.15. The price has found support on the $166.15 line. The daily chart is trending above the 200-day simple moving average (SMA 200), SMA 50 and SMA 20 curves. The signal line is looking to converge with the moving average convergence/divergence line, indicating decreasing bullish momentum.
DASH/USD 4-hour chart
-636972001186077908.png)
The 20-day Bollinger band’s jaw has widened, indicating increasing market volatility. The DASH/USD 4-hour price was trending above the upper curve of the Bollinger band before the price corrected and the plummeted (probably triggered by Coinbase outage). The price went below the lower curve of the Bollinger band. The Elliot oscillator has had two straight bearish sessions after two consecutive bullish sessions. The SMA 20 and SMA 50 are trending above the price.
DASH/USD hourly chart
-636972000824821252.png)
The hourly price is below the red Ichimoku cloud. The price is trending below the SMA 200, SMA 50 and SMA 20 curves. The SMA 50 is looking to converge them above the SMA 20 curve, which is a bearish sign. The relative strength index (RSI) indicator is trending around 36 right above the oversold territory.
Key Levels
