- Dogecoin price spell out a cup and handle pattern with a target above $0.405.
- Dogecoin robust support is provided by the 50-day and 200-day SMAs.
- The 100-day SMA at $0.30 proves to be a significant hurdle for DOGE’s rally continuation.
Dogecoin is exchanging hands 70% higher than the July 20 low at around $0.158. Recovery has been slow but steady, probably due to bear’s congestion around the $0.20 resistance level and the 50-Day and 100-day Simple Moving Averages (SMAs). At press time, DOGE was trading at $0.270 on most crypto trading platforms while battling overhead pressure from the 100-day SMA at the $0.30 resistance zone. Note that a daily candlestick closure above this level will see the Dogecoin price breakout upwards as bulls eye $0.405, 43% above the current price.
Dogecoin Price Nurtures a Cup and Handle Chart Pattern
DOGE price appears to have taken the form of a cup and handle structure on the daily chart, indicating a bullish outlook aiming for higher prices.
On Thursday, Dogecoin tested the June 25 high around $0.290. This implies that the bulls are determined to regain the multi-month DOGE price losses. This bullish bias is currently secured by the 50-day SMA support base at $0.221 forming the right side of a cup and handle chart pattern.
Note that the measured move of the cup and handle pattern for the Dogecoin price is 43% suggesting a price target of $0.405. The target falls short of the June 03 high above $0.45.
Dogecoin needs to breakout above the June 25 high of $0.290 and the handle high of $0.296 to overcome the selling pressure and take DOGE out of the handle. If this happens, the odds of an upward swing towards $0.45 will increase. This upswing will however be met by resistance by the 100-day SMA at $0.30 and the $0.330 resistance levels.
DOGE/USD Daily Chart
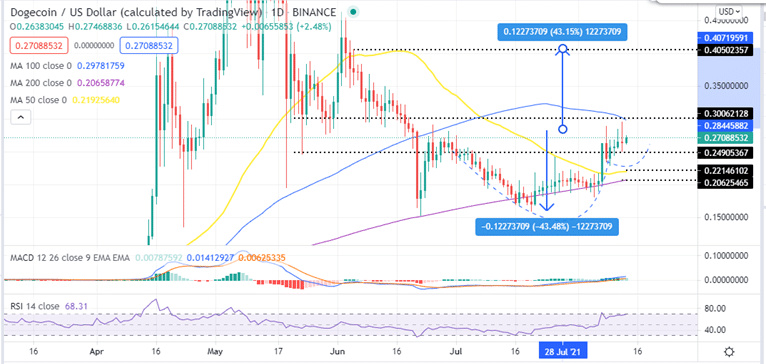
This bullish narrative is accentuated by the upward movement of the Moving Average Convergence Divergence (MACD) indicator above the zero line in the positive region. Moreover, the entry of the Relative Strength Index (RSI) into the overbought region shows that buyers are in control of the meme cryptocurrency.
Can DOGE’s Bullish Narrative Be Invalidated?
Dogecoin’s bullish thesis could be invalidated if Dogecoin closes the day below the 50-day SMA at $0.221. If this happens, it the odds for a deeper correction would increase that would see DOGE fall to the 200-SMA at $0.206 or the July 20 low around $0.159. Moreover, a daily closure below the August 05 low at $0.18 will turn the Dogecoin price prediction extremely bearish pushing the price even lower.
The oversold RSI accentuates this bullish narrative indicating that the buyer enthusiasm could be overheated and that a trend reversal could occur in the near term.
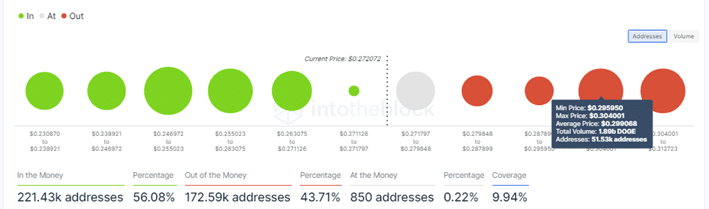
Moreover, IntoTheBlock’s IOMAP model indicates that DOGE path upwards faces significant resistance at the $0.30 zone where approximately 1.89 billion DOGE were previously bought by roughly 51,530 addresses.
Looking to buy or trade Dogecoin now? Invest at eToro!
Capital at risk
