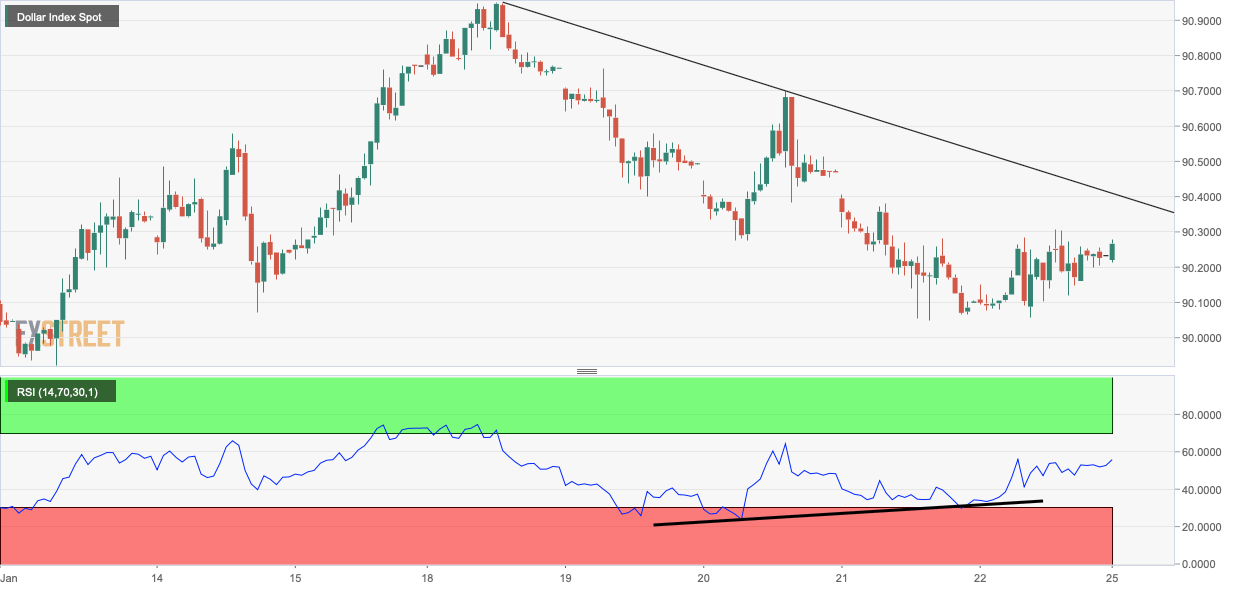
- The dollar index eyes hourly chart descending trendline hurdle.
- A breakout could pave the way for an inverse H&S pattern.
The dollar index (DXY), which tracks the greenback’s value against majors, is sidelined near 90.25 at press time, having jumped 0.12% on Friday.
The bullish divergence of the hourly chart Relative Strength Index (RSI) suggests scope for an extension of Friday’s gain toward the descending trendline hurdle, currently at 90.38.
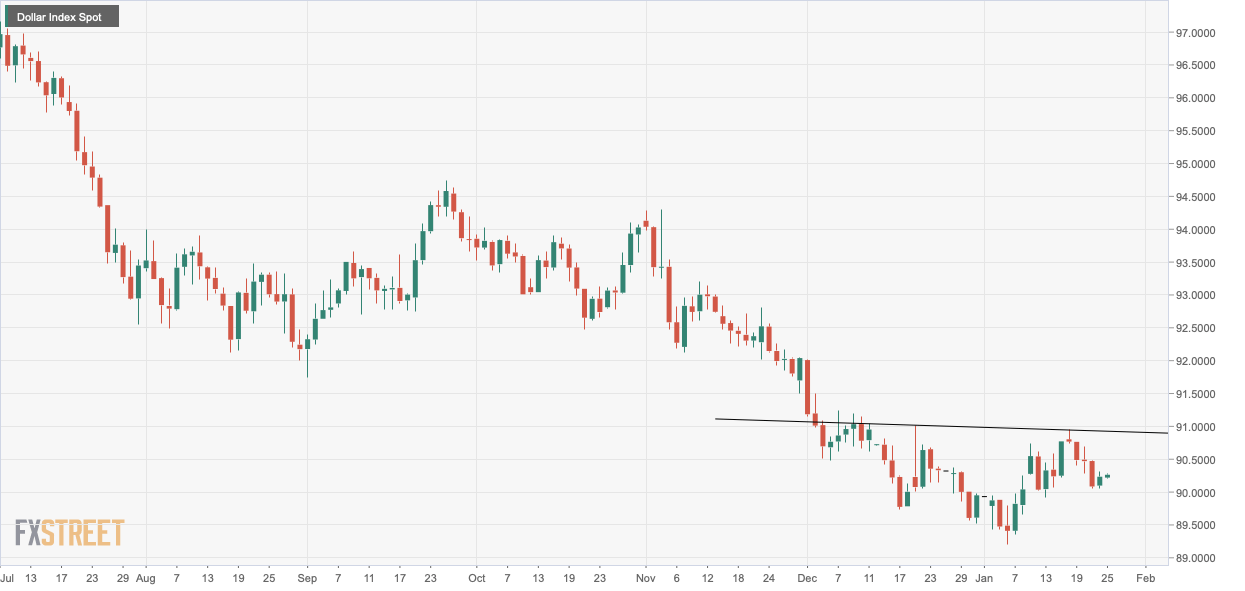
Acceptance above that level would imply an end of the pullback from the Jan. 18 high of 90.95 and open the doors for completion of the right shoulder of the inverse head-and-shoulders (H&S) pattern on the daily chart.
The neckline hurdle of the potential inverse head-and-shoulders would be near 90.92. A breakout would imply a bearish-to-bullish trend change. On the downside, Friday’s low of 90.05 is the level to beat for the bears.
The US 10-year yield remains flat near 1.09% for the seventh straight day, having rallied from 0.905 to 1.17% earlier this month. However, the US inflation expectations continue to rise on expectations for bigger fiscal spending under Joe Biden’s Presidency.
As such, the yields are more likely to resume the rally and put a bid under the greenback.
Daily chart
Hourly chart
Trend: Bullish
Technical levels
