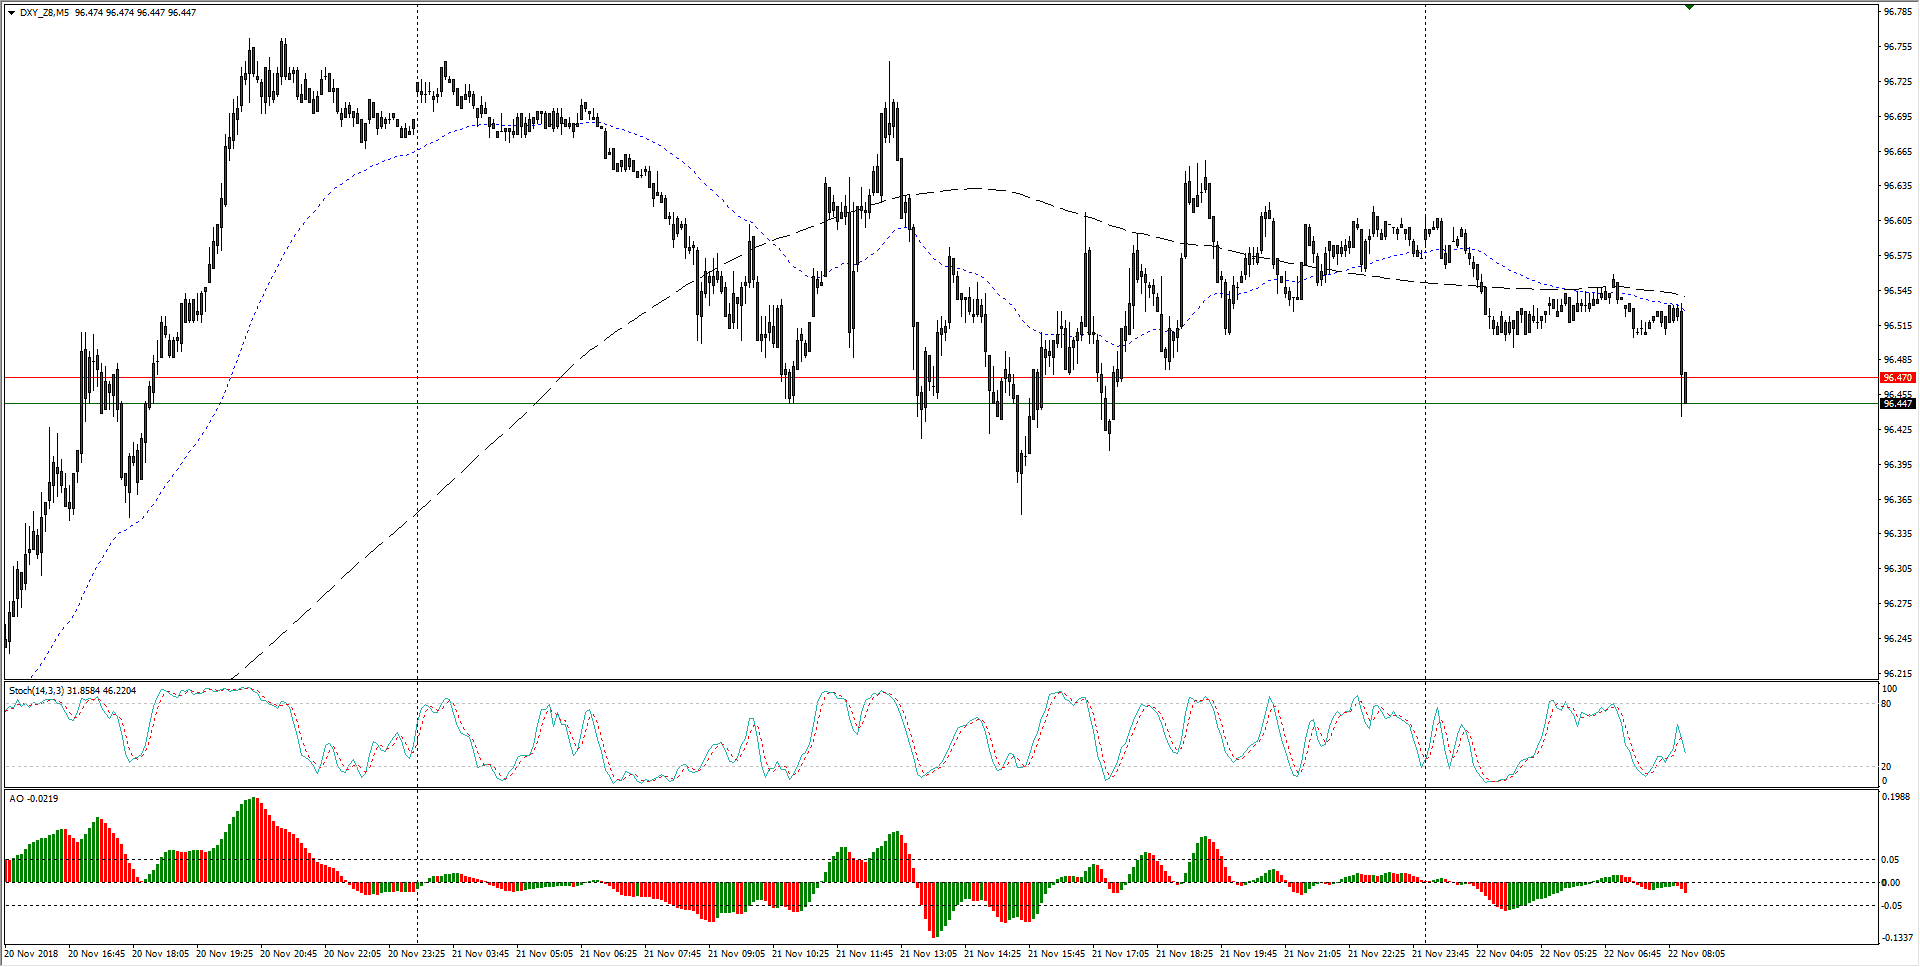
- Over the past twenty-four hours, the Dollar Index has failed to generate a meaningful bullish play, and the sideways action sees the DXY prone towards intraday drops into the 96.40 region.
DXY Chart, 5-Minute
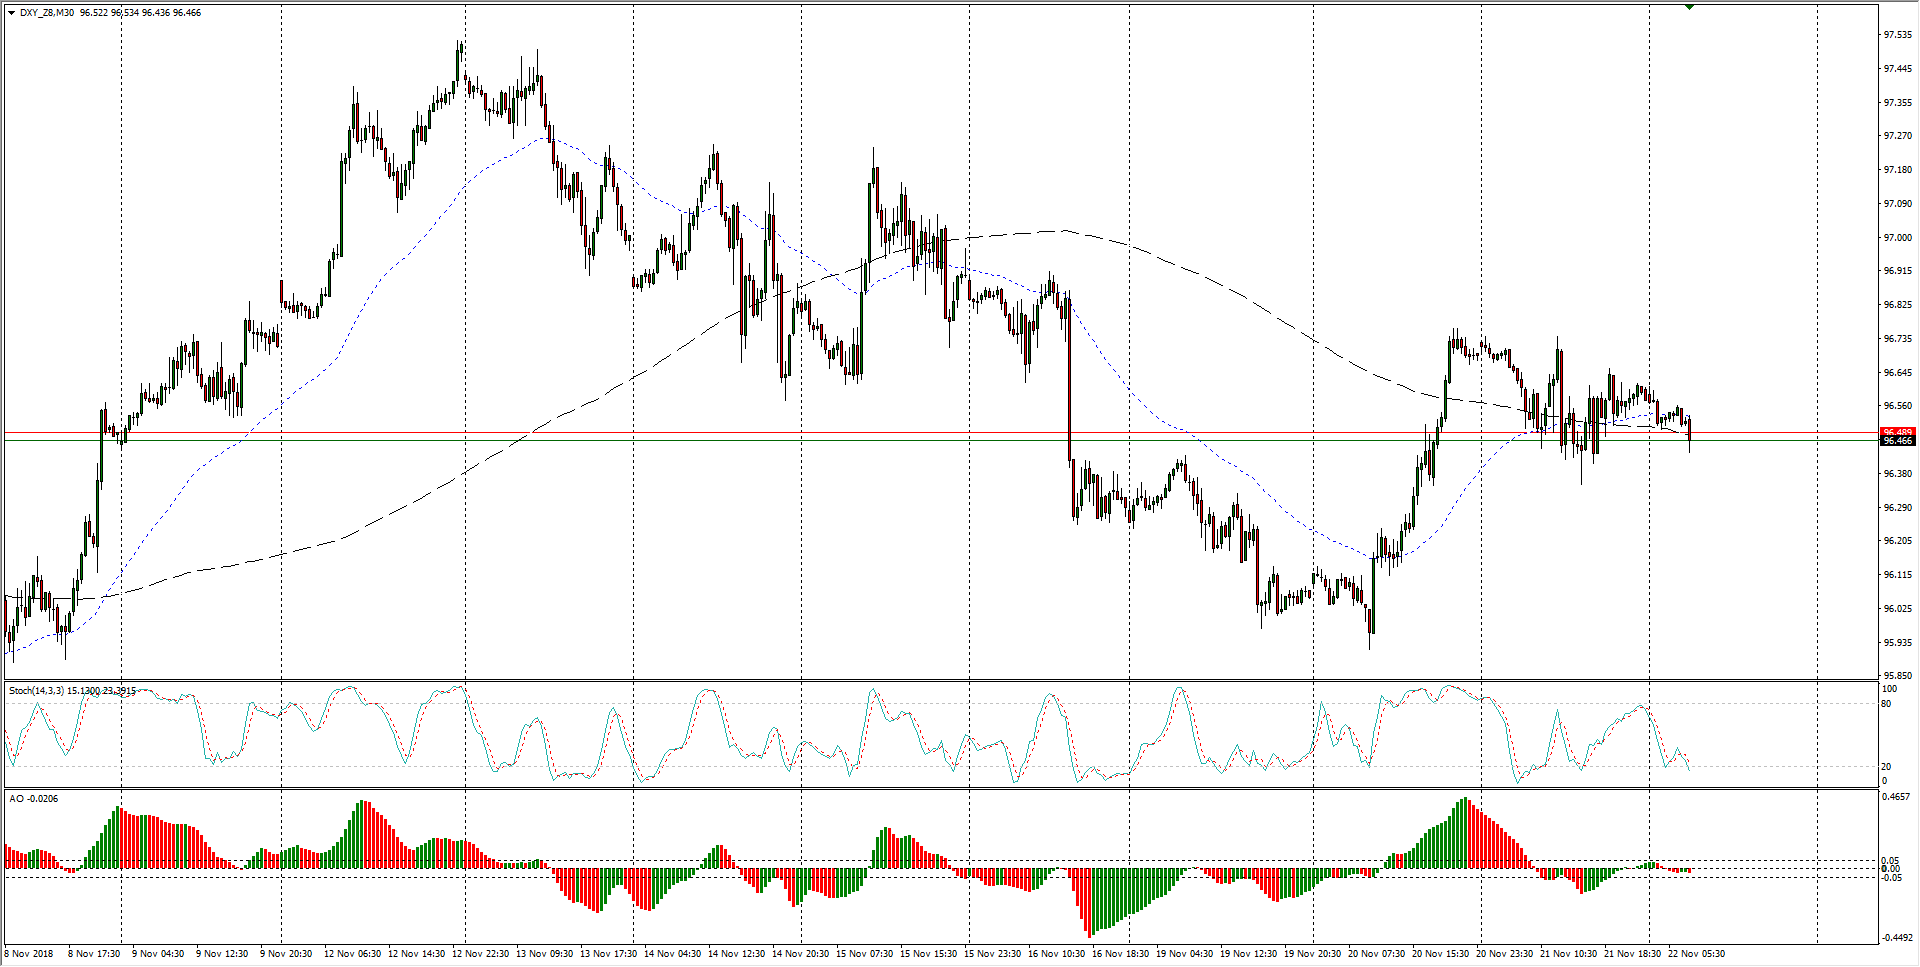
- The last two weeks see the Dollar Index drifting towards the downside, but intermittent bouts of Dollar-bidding is keeping the DXY chart roughshod through 30-Minute candles.
DXY Chart, 30-Minute
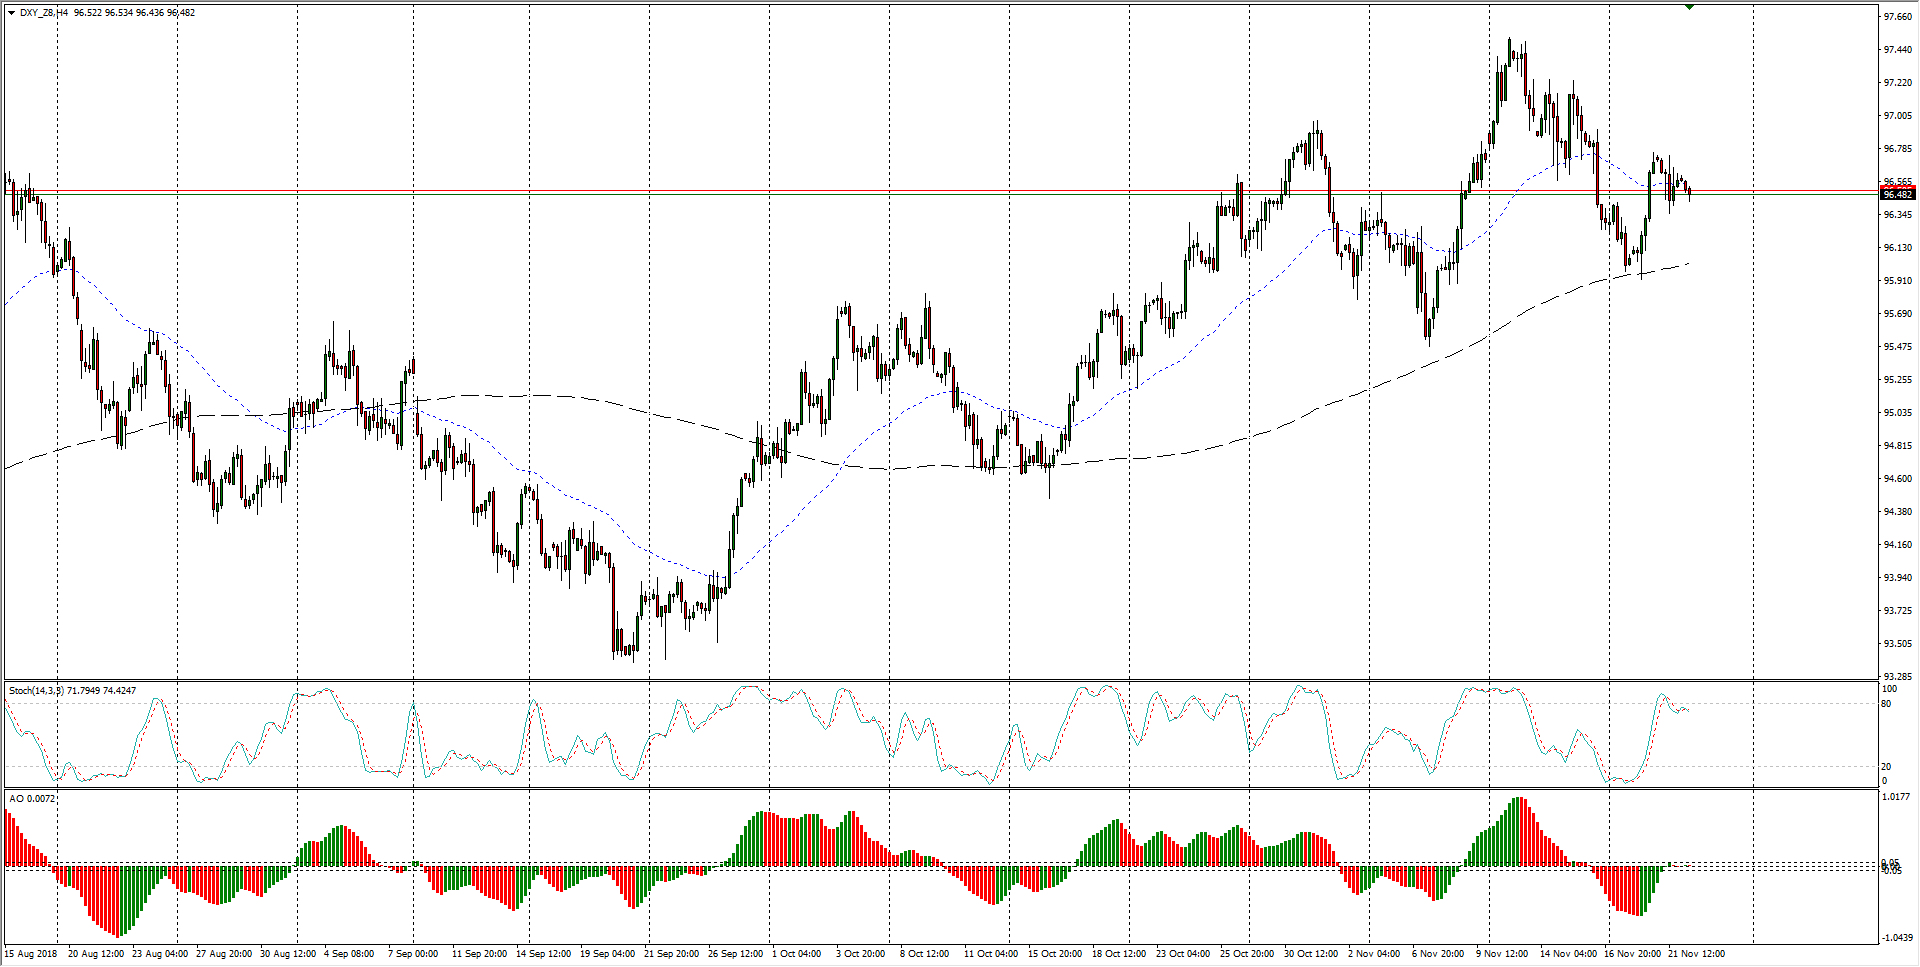
- In the medium-term, the US Dollar is catching mid flows into successive higher lows, but volatility is on the rise as reversals become a common pattern.
DXY Chart, 4-Hour
Dollar Index Spot
Overview:
Last Price: 96.64
Daily change: -8.0 pips
Daily change: -0.0827%
Daily Open: 96.72
Trends:
Daily SMA20: 96.7
Daily SMA50: 95.79
Daily SMA100: 95.43
Daily SMA200: 93.64
Levels:
Daily High: 96.87
Daily Low: 96.49
Weekly High: 97.7
Weekly Low: 96.4
Monthly High: 97.2
Monthly Low: 94.79
Daily Fibonacci 38.2%: 96.64
Daily Fibonacci 61.8%: 96.72
Daily Pivot Point S1: 96.52
Daily Pivot Point S2: 96.31
Daily Pivot Point S3: 96.14
Daily Pivot Point R1: 96.9
Daily Pivot Point R2: 97.07
Daily Pivot Point R3: 97.28
