- The Dollar Index has developed a major Double Top reversal pattern.
- DXY drops after failing to stabilize above the 93.00 psychological level.
- The descending pitchfork’s upper median line (UML) could stop the current sell-off.
The DXY Dollar Index price accelerates its drop before the US Prelim UoM Consumer Sentiment will be released. Personally, I believe that only some better-than-expected data could save the dollar from the downside.
–Are you interested to learn more about forex bonuses? Check our detailed guide-
The US Import Prices increased by 0.3% versus 0.6% expected compared to 1.1% in the previous reporting period. In addition, Prelim UoM Inflation and Consumer Sentiment figures were released in the recent hour. The data missed expectations with a big number. This can potentially further weigh on the US Dollar.
DXY technical analysis on the daily chart
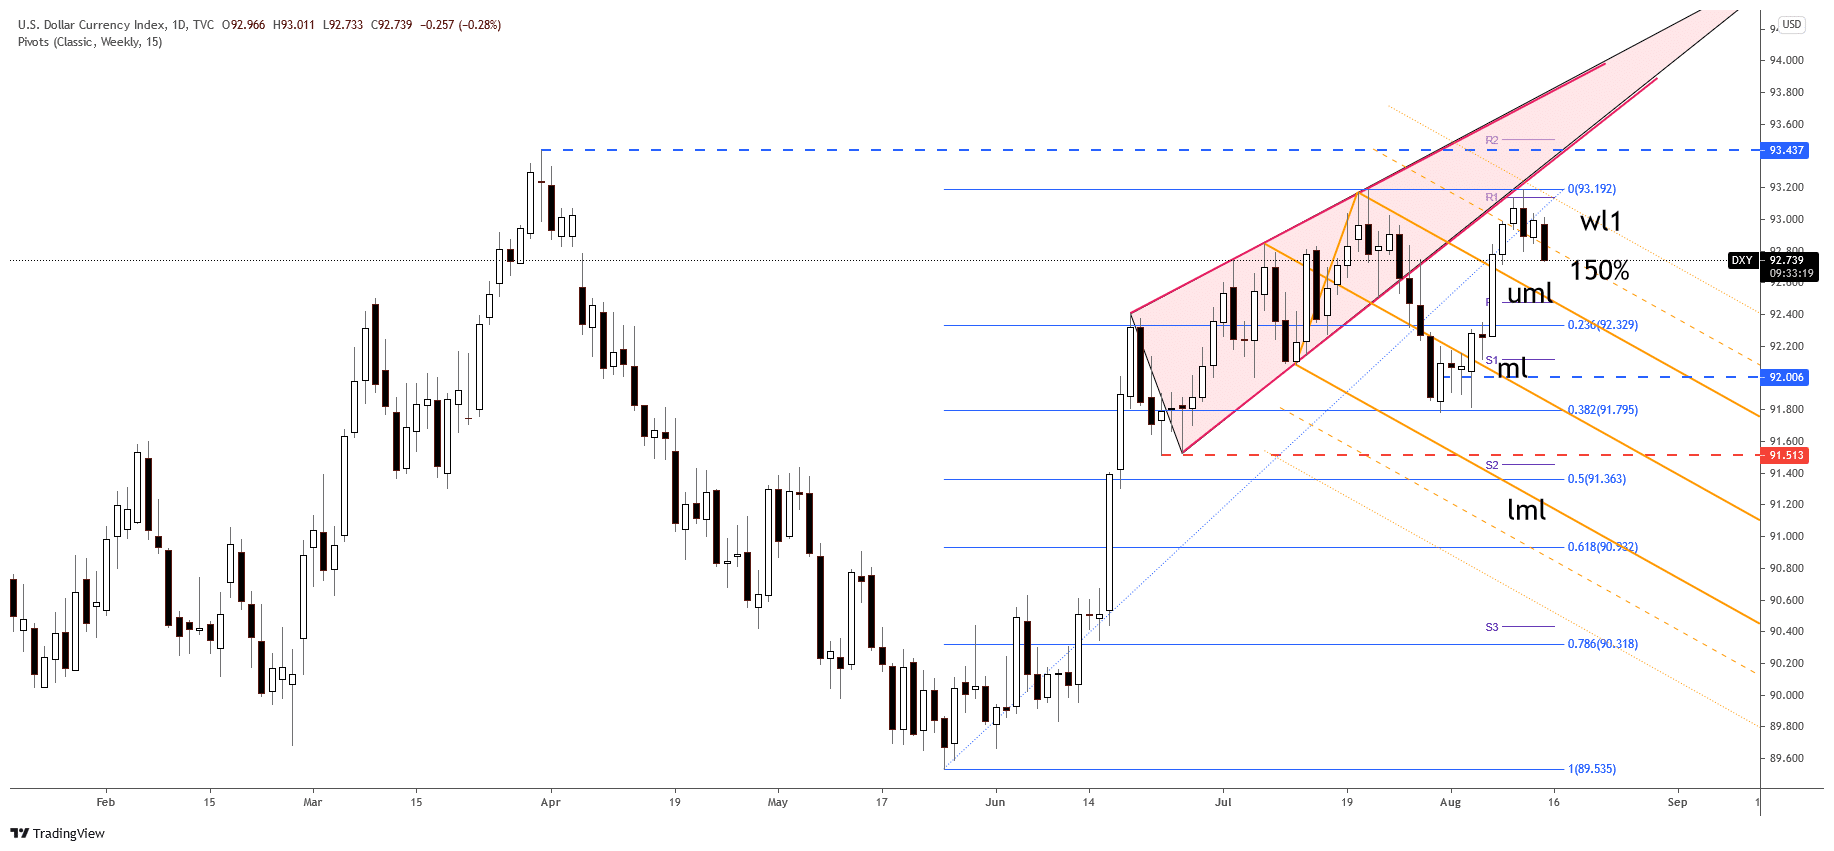
The DXY increased as much as 93.19 on Wednesday, reaching the 93.19 former high. So, it has reached a static resistance level. Closing far below 93.19, obstacles signaled exhaustion and a potential downside movement.
Technically, a temporary decline was somehow expected after the last swing higher. However, it has failed to approach and reach the warning line (wl1), so a drop towards the upper median line (UML) is somehow expected.
Dropping deeper, the DXY signals that the US Dollar could depreciate versus its rivals in the short term. But technically, the index has invalidated a larger correction, so the current drop could be only a temporary one. After that, it could test and retest the upper median line (UML) before jumping higher.
DXY price technical analysis (4-hour chart): Key levels to watch
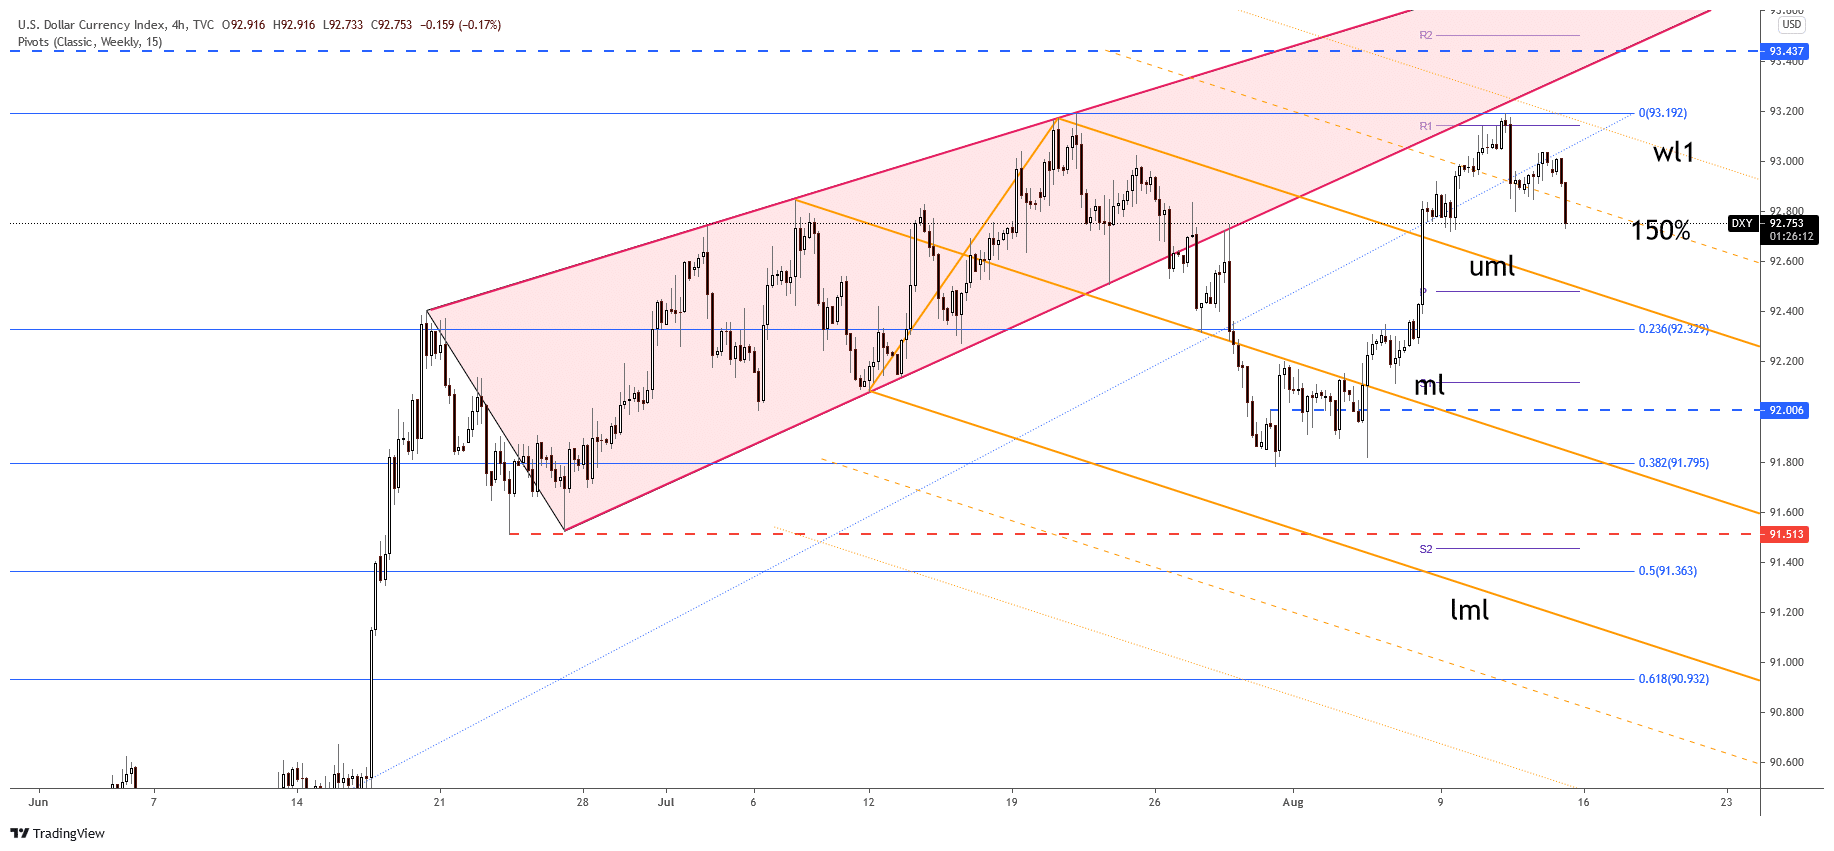
DXY is located far below the 150% Fibonacci line. Therefore, stabilizing below it may signal further decline towards the upper median line (UML). If this scenario takes shape, the USD could resume its depreciation versus its rivals.
–Are you interested to learn more about day trading brokers? Check our detailed guide-
Failing to stabilize above the 93.00 psychological level signaled that DXY could drop. The weekly pivot point is located at 92.48. Making a consolidation above this level and above the upper median line, a sideways movement could signal that the correction is over.
Technically, the Dollar Index printed a potential Double Top pattern. Still, the reversal pattern could be activated only by a valid breakdown below the 38.2% (91.79) retracement level. The index is located far above this level, so it’s premature to discuss a potential bearish reversal.
Coming back above the 150% Fibonacci line after ending its drop may signal an important swing higher.
Looking to trade forex now? Invest at eToro!
67% of retail investor accounts lose money when trading CFDs with this provider. You should consider whether you can afford to take the high risk of losing your money.
