- The DXY moves sideways before the ECB Conference and ahead of the US Advance GDP, these high-impact events could bring sharp movements.
- An upside breakout from the current range could bring an upside continuation.
- The median line (ml) could attract the price after its failure to approach the lower median line (lml).
The DXY forecast sees the dollar index trading in the red at 93.77 and came under massive pressure right after the ECB released its Main Refinancing Rate and after the Monetary Policy Statement.
The European Central Bank left its monetary policy unchanged in the October meeting. Still, you should be careful as the volatility is high, anything could happen in the short term.
If you are looking for a good forex broker to make your trades on, then read our comprehensive guide.
The next hour could be decisive for the DXY. The index is trapped within a range pattern. Most likely the rate will escape from this pattern after the ECB Press Conference. This is seen as a high-impact event today.
3 Free Forex Every Week – Full Technical Analysis
Also, the United States is to release its Advance GDP. The economic indicator is expected to register a 2.6% growth versus 6.7% in the previous reporting period. The volatility will be high around these events, so you should be careful if you are not an experienced trader.
In addition, the Advance GDP Price Index could register a 5.3% growth, the Unemployment Claims are expected to remain steady at 290K in the previous week, while the Pending Home Sales indicator may report a 0.4% in September.
Dollar Index Price Forecast: Technical Analysis – Range Formation
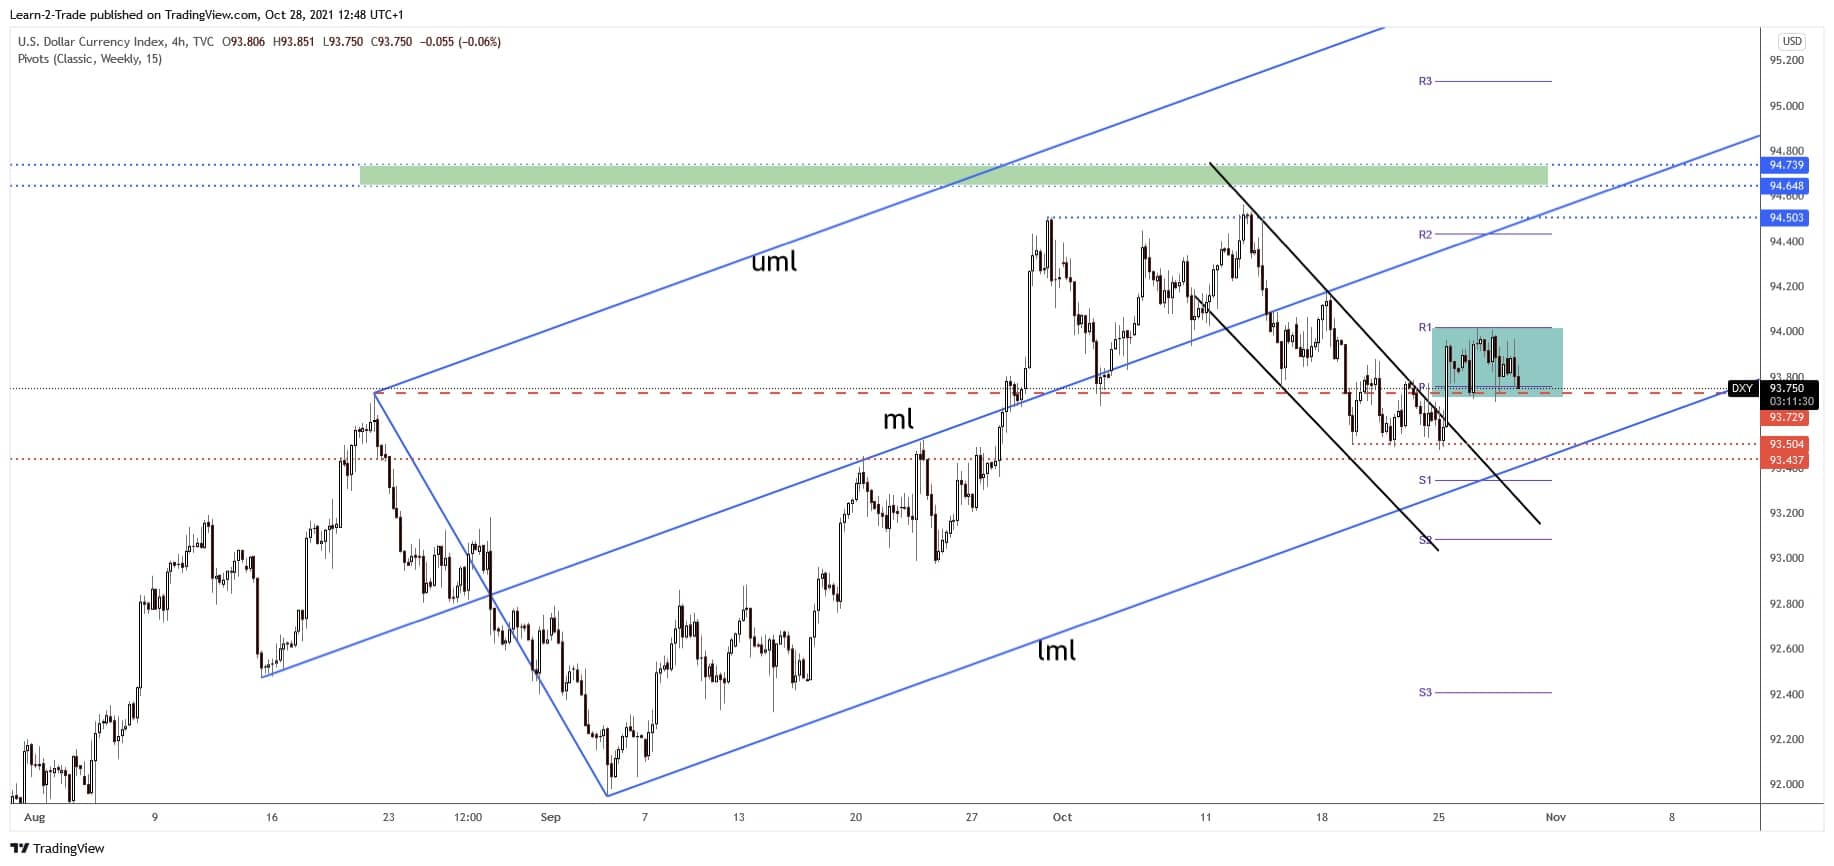
As you can see on the h4 chart, DXY continues to move sideways above the 93.72 key support level, above the 93.76 weekly pivot. After escaping from the down channel, the Dollar Index was somehow expected to grow. The current range pattern could represent a continuation formation if the rate makes an upside breakout.
So, a valid breakout through the R1 (94.02), a new higher high could really validate an upside continuation. DXY’s further growth should help the USD to appreciate versus all its rivals. Anything could happen, so you should be ready also for false breakouts from this range pattern. A false breakout could signal a valid breakout in the opposite direction.
Technically, the Dollar Index is still under bullish pressure after registering several false breakouts below the immediate support levels. The index could be attracted by the median line (ml) if it makes a new higher high.
Looking to trade forex now? Invest at eToro!
68% of retail investor accounts lose money when trading CFDs with this provider. You should consider whether you can afford to take the high risk of losing your money.
