- Following Tuesday’s bullish ‘outside day’, the index closed at/above 95.06 on Wednesday, allowing the continuation of the up move and targeting YTD tops in the 95.50/55 band.
- As long as the 3-month support line – today at 94.43 – holds, the upside bias in the buck should remain unchanged, facing the immediate target at 95.53 ahead of the psychological 96.00 the figure.
- In case of the re-emergence of the selling mood, initial contention is located in the 95.40 area, Wednesday’s hourly highs. Further contention emerges in the 94.70 region, where aligns the 10-day and 21-day SMA, followed by the 3-month support line.
- The daily ADX reads 22.51, indicative of a weak trend, however.
DXY hourly chart
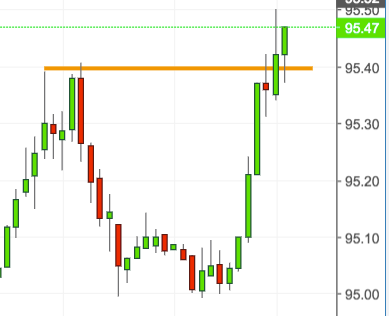
Daily high: 95.50
Daily low: 94.99
Support Levels
S1: 94.91
S2: 94.71
S3: 94.46
Resistance Levels
R1: 95.36
R2: 95.61
R3: 95.81
