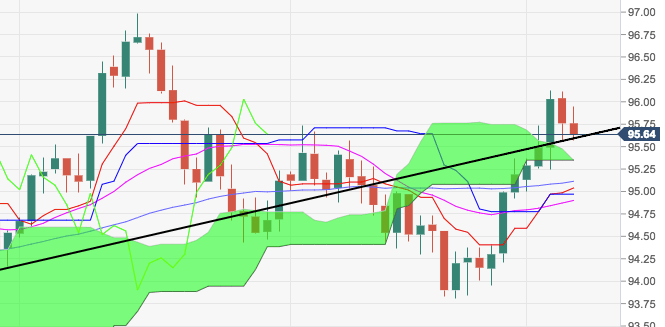
- DXY is losing further momentum in the wake of the release of September’s Non-farm Payrolls, although the decline appears to have met decent support in the boundaries of the key short-term support line around 95.60.
- As long as this line holds, another test of recent tops beyond 96.00 the figure and the 50% Fibo retracement of the 2017-2018 drop at 96.04 is not ruled out in the near term.
- A break below this support zone should see of this region should see the 55-day SMA at 95.11 and the 10-day SMA at 95.05 retested
DXY daily chart
Dollar Index Spot
Overview:
Last Price: 95.63
Daily change: -13 pips
Daily change: -0.136%
Daily Open: 95.76
Trends:
Daily SMA20: 94.86
Daily SMA50: 95.15
Daily SMA100: 94.77
Daily SMA200: 92.67
Levels:
Daily High: 96.12
Daily Low: 95.56
Weekly High: 95.37
Weekly Low: 93.84
Monthly High: 95.74
Monthly Low: 93.81
Daily Fibonacci 38.2%: 95.77
Daily Fibonacci 61.8%: 95.91
Daily Pivot Point S1: 95.51
Daily Pivot Point S2: 95.25
Daily Pivot Point S3: 94.95
Daily Pivot Point R1: 96.07
Daily Pivot Point R2: 96.37
Daily Pivot Point R3: 96.63
