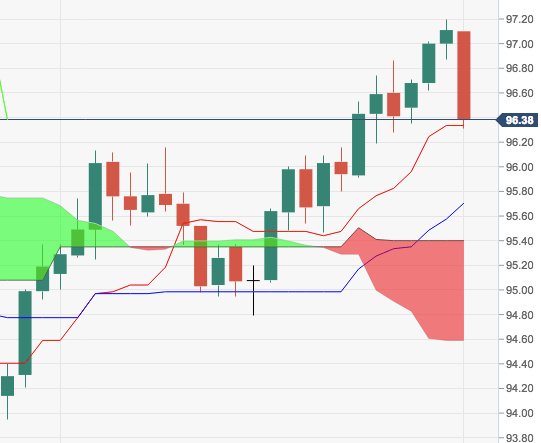
- Today’s sharp sell off in the greenback is prompting DXY to recede further from recent YTD tops near 97.20 and instead to focus on the 96.00 neighbourhood.
- In fact, the continuation of the down move is expected to face contention at 96.04, the 50% Fibo retracement of the 2017-2018 drop. A break of this level should put the 21-day SMA at 95.92 back on the horizon.
- A resumption of the uptrend faces the immediate hurdle at recent peaks at 97.19, while further upside should meet the next resistance at 97.87, where converge the 61.8% Fibo retracement of the 2017-2018 drop and June 2017 peak.
DXY daily chart
Dollar Index Spot
Overview:
Last Price: 96.37
Daily change: -74 pips
Daily change: -0.762%
Daily Open: 97.11
Trends:
Daily SMA20: 95.92
Daily SMA50: 95.3
Daily SMA100: 95.15
Daily SMA200: 93.1
Levels:
Daily High: 97.2
Daily Low: 96.87
Weekly High: 96.86
Weekly Low: 95.47
Monthly High: 97.2
Monthly Low: 94.79
Daily Fibonacci 38.2%: 97.07
Daily Fibonacci 61.8%: 97
Daily Pivot Point S1: 96.92
Daily Pivot Point S2: 96.73
Daily Pivot Point S3: 96.59
Daily Pivot Point R1: 97.25
Daily Pivot Point R2: 97.39
Daily Pivot Point R3: 97.58
