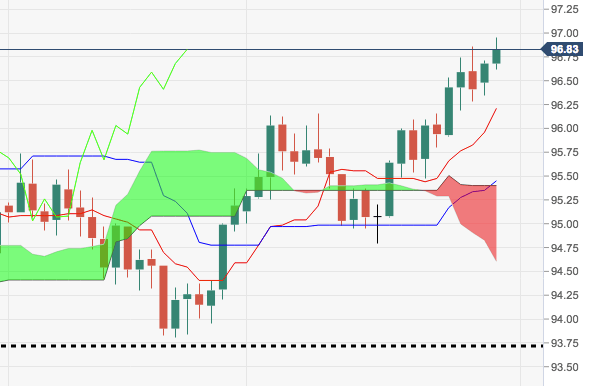
- The index is extending the positive mood on Tuesday and is approaching the critical resistance at YTD peaks in the 97.00 neighbourhood.
- A break above 97.00 is needed to extend the move further north and target the 97.87 level, where coincide a Fibo retracement of the 2017-2018 drop and June 2017 peak.
- The up trend in the buck is reinforced by the index trading above the daily cloud for the time being.
- The broader picture keeps telling that DXY stays bid as long as it trades above July’s low at 93.71.
DXY daily chart
Dollar Index Spot
Overview:
Last Price: 96.84
Daily change: 16 pips
Daily change: 0.165%
Daily Open: 96.68
Trends:
Daily SMA20: 95.79
Daily SMA50: 95.23
Daily SMA100: 95.09
Daily SMA200: 93.03
Levels:
Daily High: 96.71
Daily Low: 96.35
Weekly High: 96.86
Weekly Low: 95.47
Monthly High: 95.74
Monthly Low: 93.81
Daily Fibonacci 38.2%: 96.57
Daily Fibonacci 61.8%: 96.49
Daily Pivot Point S1: 96.45
Daily Pivot Point S2: 96.22
Daily Pivot Point S3: 96.09
Daily Pivot Point R1: 96.81
Daily Pivot Point R2: 96.94
Daily Pivot Point R3: 97.17
