- Despite yesterday’s positive performance, the greenback remains under pressure so far this week.
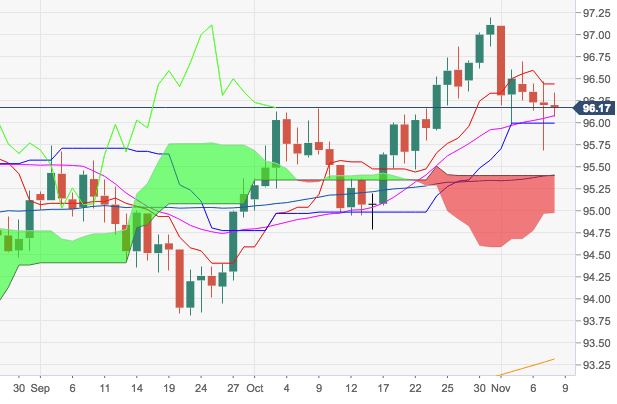
- Key contention area still emerges around the 96.00 neighbourhood, where coincide a Fibo retracement of the 2017-2018 drop, the 21-day SMA and early October’s peaks.
- Looking at the broader picture, the positive stance bias should remain intact as long as 93.71 underpins (July low).
DXY daily chart
Dollar Index Spot
Overview:
Last Price: 96.15
Daily change: -5.0 pips
Daily change: -0.0520%
Daily Open: 96.2
Trends:
Daily SMA20: 96.08
Daily SMA50: 95.44
Daily SMA100: 95.22
Daily SMA200: 93.28
Levels:
Daily High: 96.47
Daily Low: 95.68
Weekly High: 97.2
Weekly Low: 95.99
Monthly High: 97.2
Monthly Low: 94.79
Daily Fibonacci 38.2%: 95.98
Daily Fibonacci 61.8%: 96.17
Daily Pivot Point S1: 95.76
Daily Pivot Point S2: 95.33
Daily Pivot Point S3: 94.97
Daily Pivot Point R1: 96.55
Daily Pivot Point R2: 96.91
Daily Pivot Point R3: 97.34
