- After testing weekly lows near 94.90 earlier in the day, DXY has now retraced the up move and returned to the mid-94.00s.
- On the daily chart, interim resistance emerges in the 94.68/71 band, home of the 21- and 10-day sma.
- A close above this area is necessary in order to allow for further gains initially to the 95.00 milestone ahead of 2018 peaks in the 95.60/65 band.
- The constructive outlook stays unchanged as long as DXY trades above the daily cloud, the 10-day SMA remains above the 2-day SMA and the immediate support line keeps sustaining the sentiment in USD-bulls.
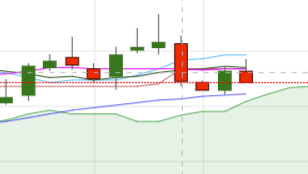
DXY daily chart
Daily high: 94.86
Daily low: 94.42
Support Levels
S1: 94.32
S2: 94.01
S3: 93.81
Resistance Levels
R1: 94.83
R2: 95.03
R3: 95.34
