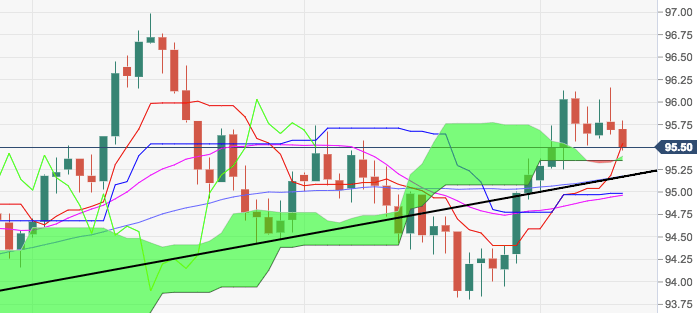
- The greenback is now accelerating the downside and trades in fresh weekly lows in the mid-95.00s.
- The continuation of the down move could see the short-term support line at 95.17 tested.
- In the meantime, the constructive view remains in place as long as this support line underpins, with the immediate target at recent peaks beyond 96.00 the figure.
- Sustaining further the outlook, DXY continues to trade above the daily cloud.
DXY daily chart
Dollar Index Spot
Overview:
Last Price: 95.46
Daily change: -23 pips
Daily change: -0.240%
Daily Open: 95.69
Trends:
Daily SMA20: 94.94
Daily SMA50: 95.22
Daily SMA100: 94.83
Daily SMA200: 92.72
Levels:
Daily High: 96.16
Daily Low: 95.64
Weekly High: 96.13
Weekly Low: 95
Monthly High: 96.13
Monthly Low: 93.81
Daily Fibonacci 38.2%: 95.84
Daily Fibonacci 61.8%: 95.96
Daily Pivot Point S1: 95.5
Daily Pivot Point S2: 95.31
Daily Pivot Point S3: 94.98
Daily Pivot Point R1: 96.02
Daily Pivot Point R2: 96.35
Daily Pivot Point R3: 96.54
