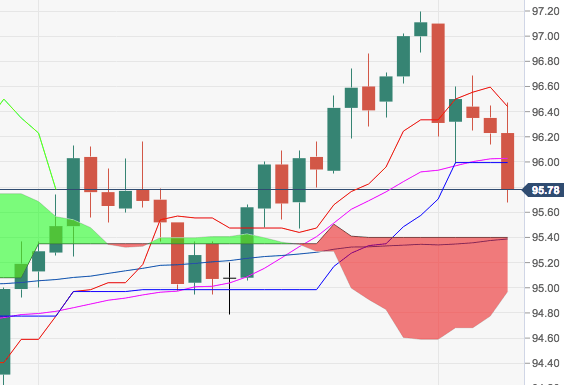
- The greenback accelerated the weekly leg lower following the results from the US mid-term elections and is now testing multi-day lows in the 95.85/80 band.
- DXY broke below the critical support at 96.00 the figure and in doing so has opened the door for a potential drop and test of the 95.40 region, where coincide the 55-day SMA and the top of the daily cloud.
- However, the constructive bias should remain unchanged while above the 93.71 level, July’s low.
DXY daily chart
Dollar Index Spot
Overview:
Last Price: 95.8
Daily change: -43 pips
Daily change: -0.447%
Daily Open: 96.23
Trends:
Daily SMA20: 96.04
Daily SMA50: 95.41
Daily SMA100: 95.21
Daily SMA200: 93.24
Levels:
Daily High: 96.45
Daily Low: 96.14
Weekly High: 97.2
Weekly Low: 95.99
Monthly High: 97.2
Monthly Low: 94.79
Daily Fibonacci 38.2%: 96.26
Daily Fibonacci 61.8%: 96.33
Daily Pivot Point S1: 96.1
Daily Pivot Point S2: 95.96
Daily Pivot Point S3: 95.79
Daily Pivot Point R1: 96.41
Daily Pivot Point R2: 96.58
Daily Pivot Point R3: 96.72
