- Following a drop to fresh multi-day lows in the 94.30 region, the buck met dip-buyers and is now flirting with the initial upside target located at 94.60, where sits the 21-day SMA.
- DXY needs to overcome last Friday’s peak at 95.24 in order to resume the up move and set sails for a potential test of 2018 peaks in the mid-95.00s and then the 96.00 mark.
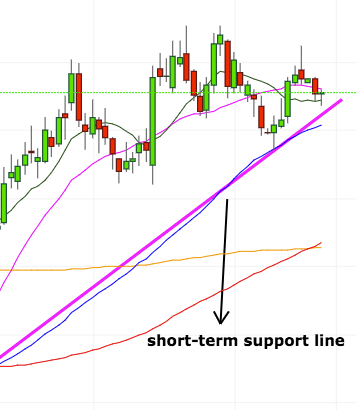
- In the meantime, the buck remains ‘just’ underpinned by the 3-month support line off 89.23 (mid-April), today in the 94.30/20 band.
- Strong support should emerge around the 94.00 neighbouhood, where converge the 55-day SMA and a retracement of the April-June rally.
DXY daily chart
Daily high: 94.65
Daily low: 94.29
Support Levels
S1: 94.36
S2: 94.20
S3: 94.00
Resistance Levels
R1: 94.72
R2: 94.92
R3: 95.08
