- The index is losing ground for the first time after six consecutive daily advances, meeting strong resistance around recent tops beyond 96.00 the figure, coincident with the 50% Fibo retracement of the 2017-2018 drop.
- The greenback came under rising selling pressure after entering the ‘overbought’ territory in the hourly chart earlier in the session and is now putting to the test the key short-term support line in the 95.60 area.
- A loss of this region should see interim contention emerging at 95.09, where lies the 55-day SMA ahead of 94.90, home of the 10-day SMA.
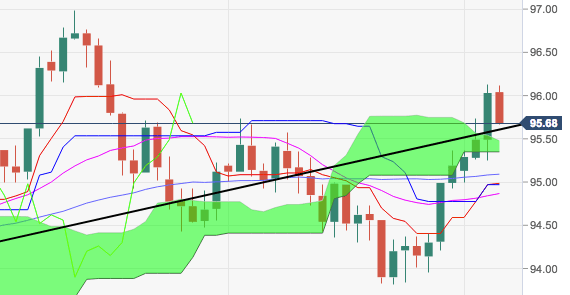
DXY daily chart
Daily high: 96.12
Daily low: 95.66
Support Levels
S1: 95.48
S2: 94.92
S3: 94.60
Resistance Levels
R1: 96.36
R2: 96.68
R3: 97.24
