- The index is up for the second session in a row today and is now looking to extend the recent breakout of the critical barrier at 95.00 the figure.
- Key resistance remains the 95.40 region, where sit recent peaks and the 10-day SMA.
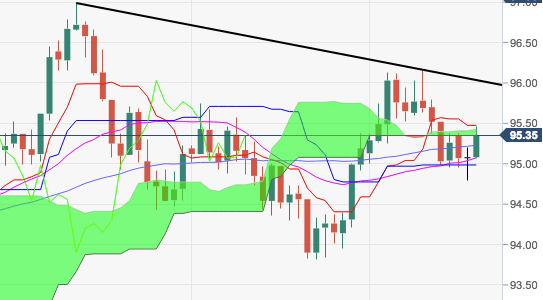
- Immediate target on the upside is the 95.40 region, where aligns recent tops and the base of the daily cloud. This area is considered the last defence ahead of a test of October’s tops beyond the 96.00 mark, where is also located a Fibo retracement of the 2017-2018 drop and the short-term resistance line.
DXY daily chart
Dollar Index Spot
Overview:
Last Price: 95.35
Daily change: 27 pips
Daily change: 0.284%
Daily Open: 95.08
Trends:
Daily SMA20: 95.06
Daily SMA50: 95.23
Daily SMA100: 94.88
Daily SMA200: 92.79
Levels:
Daily High: 95.2
Daily Low: 94.79
Weekly High: 96.16
Weekly Low: 94.95
Monthly High: 96.16
Monthly Low: 93.81
Daily Fibonacci 38.2%: 95.04
Daily Fibonacci 61.8%: 94.95
Daily Pivot Point S1: 94.85
Daily Pivot Point S2: 94.61
Daily Pivot Point S3: 94.44
Daily Pivot Point R1: 95.26
Daily Pivot Point R2: 95.43
Daily Pivot Point R3: 95.67
