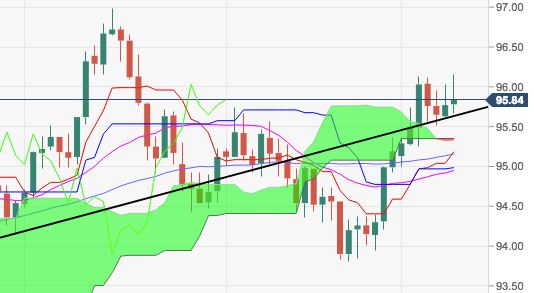
- DXY has once again tested the area above 96.00 the figure but lacked of follow through, prompting the ongoing retracement along with a similar performance in yields of the US 10-year note.
- The constructive outlook in the buck stays unchanged as long as the short-term support line underpins, today at 95.63.
- A close above recent peaks in the 96.10/15 band seems needed in order to attempt another visit of 2018 peaks just below 97.00 the figure (August 15).
- Collaborating with the positive view, DXY keeps trading above the daily cloud.
DXY daily chart
Dollar Index Spot
Overview:
Last Price: 95.82
Daily change: 5.0 pips
Daily change: 0.0522%
Daily Open: 95.77
Trends:
Daily SMA20: 94.91
Daily SMA50: 95.2
Daily SMA100: 94.81
Daily SMA200: 92.7
Levels:
Daily High: 96.03
Daily Low: 95.6
Weekly High: 96.13
Weekly Low: 95
Monthly High: 96.13
Monthly Low: 93.81
Daily Fibonacci 38.2%: 95.87
Daily Fibonacci 61.8%: 95.76
Daily Pivot Point S1: 95.57
Daily Pivot Point S2: 95.37
Daily Pivot Point S3: 95.14
Daily Pivot Point R1: 96
Daily Pivot Point R2: 96.23
Daily Pivot Point R3: 96.43
