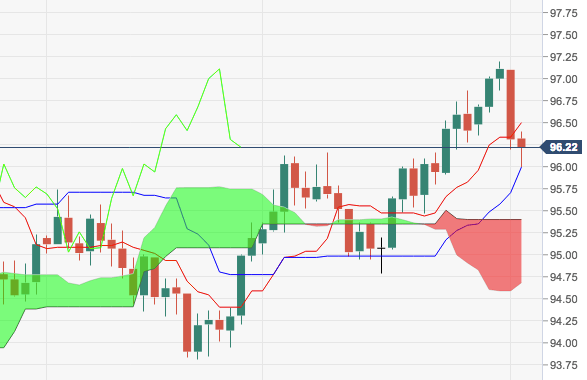
- The greenback has extended the sharp sell of to the 96.00 neighbourhood today, where lies a Fibo retracement of the 2017-2018 drop.
- The breakdown of this area of contention should open the door for a probable visit to the 21-day SMA at 95.94 ahead of the mid-95.00s.
- All in all, as long as July’s low at 93.71 underpins, the constructive bias in the greenback is expected to persist.
DXY daily chart
Dollar Index Spot
Overview:
Last Price: 96.22
Daily change: -9.0 pips
Daily change: -0.0934%
Daily Open: 96.31
Trends:
Daily SMA20: 95.94
Daily SMA50: 95.32
Daily SMA100: 95.17
Daily SMA200: 93.14
Levels:
Daily High: 97.1
Daily Low: 96.2
Weekly High: 96.86
Weekly Low: 95.47
Monthly High: 97.2
Monthly Low: 94.79
Daily Fibonacci 38.2%: 96.54
Daily Fibonacci 61.8%: 96.76
Daily Pivot Point S1: 95.97
Daily Pivot Point S2: 95.64
Daily Pivot Point S3: 95.07
Daily Pivot Point R1: 96.87
Daily Pivot Point R2: 97.44
Daily Pivot Point R3: 97.77
