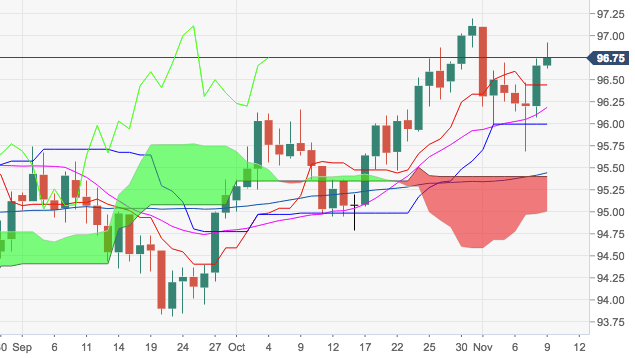
- The index is extending the strong recovery to the vicinity of the 97.00 area on Friday, moving further up after bottoming out near 95.70 on Wednesday.
- The solid up move in the buck once again opened the door for a potential visit to the 97.00 handle and above, where lies the 2018 peak at 97.19 (October 31).
- Looking at the broader picture, the positive stance bias should remain intact as long as 93.71 underpins (July low).
DXY daily chart
Dollar Index Spot
Overview:
Last Price: 96.75
Daily change: 9.0 pips
Daily change: 0.0931%
Daily Open: 96.66
Trends:
Daily SMA20: 96.16
Daily SMA50: 95.48
Daily SMA100: 95.24
Daily SMA200: 93.32
Levels:
Daily High: 96.74
Daily Low: 96.07
Weekly High: 97.2
Weekly Low: 95.99
Monthly High: 97.2
Monthly Low: 94.79
Daily Fibonacci 38.2%: 96.48
Daily Fibonacci 61.8%: 96.33
Daily Pivot Point S1: 96.24
Daily Pivot Point S2: 95.82
Daily Pivot Point S3: 95.57
Daily Pivot Point R1: 96.91
Daily Pivot Point R2: 97.16
Daily Pivot Point R3: 97.58
