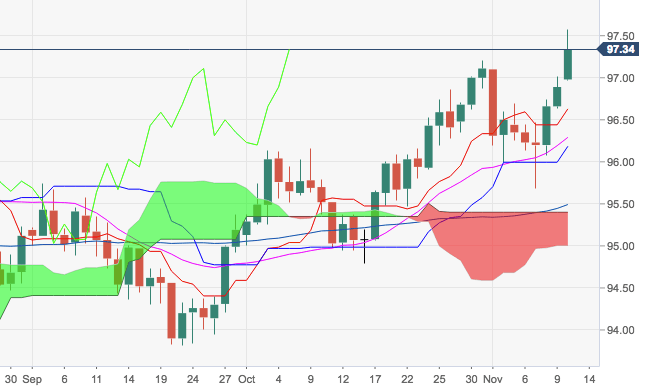
- The upbeat momentum around the greenback remain unabated for yet another session and is now pushing DXY to the 97.60 region, or fresh YTD peaks.
- The continuation of the bull run should meet the next resistance of note at 97.87, where coincide a Fibo retracement of the 2017-2018 drop and June’s 2017 top.
- In addition, the constructive stance in the greenback should remain unchanged as long as July’s low at 93.71 holds.
DXY daily chart
Dollar Index Spot
Overview:
Last Price: 97.32
Daily change: 43 pips
Daily change: 0.444%
Daily Open: 96.89
Trends:
Daily SMA20: 96.24
Daily SMA50: 95.51
Daily SMA100: 95.26
Daily SMA200: 93.36
Levels:
Daily High: 97.01
Daily Low: 96.63
Weekly High: 97.01
Weekly Low: 95.68
Monthly High: 97.2
Monthly Low: 94.79
Daily Fibonacci 38.2%: 96.86
Daily Fibonacci 61.8%: 96.78
Daily Pivot Point S1: 96.68
Daily Pivot Point S2: 96.46
Daily Pivot Point S3: 96.3
Daily Pivot Point R1: 97.06
Daily Pivot Point R2: 97.22
Daily Pivot Point R3: 97.44
