- After a promising start of the week, the index left behind part of the initial move to the vicinity of 95.40 and is now approaching the critical support at 95.00 the figure.
- The 95.40 region now emerges as the immediate interim hurdle ahead of a potential recovery to the support line, today at 95.54. This resistance area is also reinforced by the proximity of the base of the daily cloud.
- Further up lies September’s peak at 95.74 seconded by the 50% Fibo retracement of the 2017-2018 drop at 96.04.
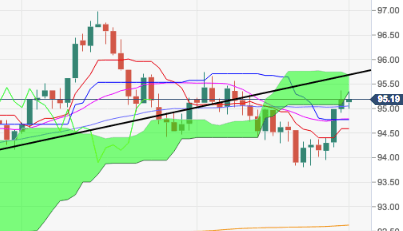
DXY daily chart
Daily high: 95.33
Daily low: 95.00
Support Levels
S1: 94.95
S2: 94.71
S3: 94.50
Resistance Levels
R1: 95.40
R2: 95.61
R3: 95.85
