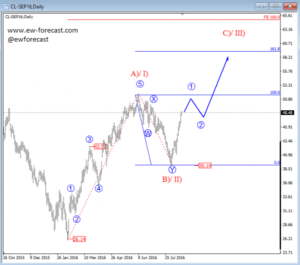
On the daily chart of crude oil, we labeled retracement down from blue wave 5 highs as a corrective move; a double zig-zag that seems completed as of the recent skyrocket upward impulsive action. That said more upside seems to be in store, with the price now trading in blue wave 1 of C) or III) with still more gains to follow, but only after any minor temporary correction that may still show up.
Crude OIL, Daily
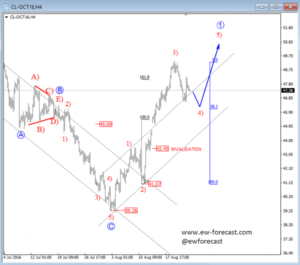
On the 4h chart of crude oil we can see that the price made a nice rally from the lows, for now in three waves but because of strong bullish momentum with a sharp price action up to 161.8% Fibonacci ratio, we believe the market made wave 3) as part of a bullish impulse. That said, the current downward reversal is probably wave 4) that can move back down to 45-46 area, the region of one common Fibonacci ratio for wave four corrections, 38.2, from where a new turn up would be expected.
Crude OIL, 4H