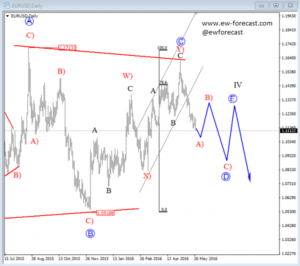
EURUSD is trading lower for the last few weeks, away from 78.6% Fibonacci level after that broken channel support line connected from wave X). In fact, the fall is quite sharp so we are confident that it belongs to a bigger decline; thus a three wave drop down in wave D circled that is part of a big triangle placed in wave IV.
EURUSD, Daily
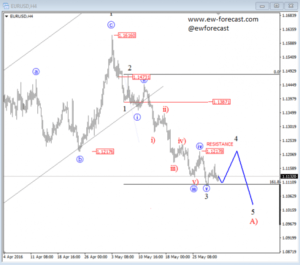
On the lower time frame, EURUSD fell to new lows recently after a very sharp and simple corrective bounce up to 1.1217, which we think was wave four within an extended wave three based on personality and time. The updated count shows that the pair might have completed wave 3 around very typical and important 161.8% Fibonacci level. As such, we should be aware of a new bounce this week, ideally once again back to that 1.1217 resistance from where we will expect another decline; to lower prices within wave A). This is a part of a big wave D within a triangle as shown on the daily chart.
EURUSD, 4H
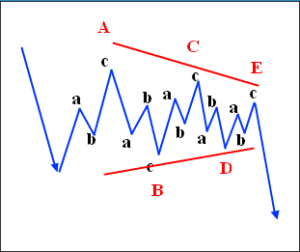
A Triangle is a common 5 wave pattern labeled A-B-C-D-E that moves counter-trend and is corrective in nature. Triangles move within two channel lines drawn from waves A to C, and from waves B to D. Triangles are overlapping five wave affairs that subdivide into 3-3-3-3-3.
A Basic Triangle Pattern: