Home Elliott Wave Analysis: USD Index continuing its bullish run
Daily Look

Elliott Wave Analysis: USD Index continuing its bullish run

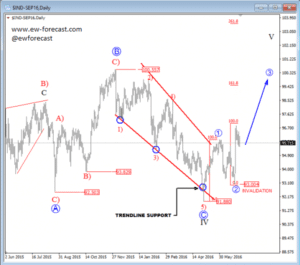
On USD index daily chart we are observing a big sideways pattern since the start of 2015; its slow, sideways and overlapping price action takes a personality of a contra-trend movement that can be completed now. We see it as a flat correction in black wave IV; a three wave structure where the final wave C should be made by five waves. Well, we have seen a nice decline from November of 2015 counted in five legs, but as an ending diagonal. That’s a reversal pattern that already caused a strong bounce in May, so ideally the recent sharp leg down was just a pullback labeled as wave two within an ongoing uptrend and the recent sharp turn to the upside is undergoing wave 3, which could ideally reach 99 region.

USD Index, Daily

dx d


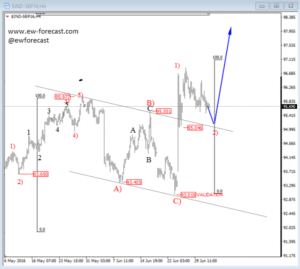
On the lower time frames, as expected, the price made a nice reversal higher at 93.00 area where a three wave corrective retracement had completed. Now we think that the price could already be in a new bullish sequence which can reach 98.60 area in the days ahead, where 161.8 Fibonacci projected level can be met. Currently we see the price in a correction in sub-wave 2), which can find its possible support  and a turning point higher around the upper channel line and previous wave B) swing at 95.55.

USD Index, 4H

dx 4

Gregor Horvat

Gregor Horvat

Grega Horvat Grega is based in Slovenia and has been involved in markets since 2003. He is the owner of Ew-Forecast, but before that he was working for Capital Forex Group and TheLFB.com. His feature articles have been published on FXstreet.com, Thestreet.com, Action forex, Forex TV, Istockanalyst, ForexFactory, Fxtraders.eu, Insidefutures.com, etc. He recently won the award on FXStreet.com for Best Forex Analysis in 2016. At Ew-forecast he helps clients and educates them about the Elliott wave principle and how to label and track unfolding patterns in real time. His approach to the markets is mainly technical. He uses a lot of different methods when analyzing the markets such as candlestick patterns, MA, technical indicators etc. His specialty, however, is Elliott Wave Theory which could be very helpful especially if you know how to use it in combination with other tools/indicators. EW-Forecast To be involved in the market effectively, you need the right guidance and resources, and our team can help you to achieve that. Our team is providing advanced informations about Elliott Wave theory in real time. The Elliott Wave Principle gives you a method for identifying the behavior of the markets and at what points the market is most likely to turn. We help new traders who are interested in Elliott Wave theory to understand it correctly. We are doing our best to explain our views as simple as possible with educational goal, because knowledge itself is power!