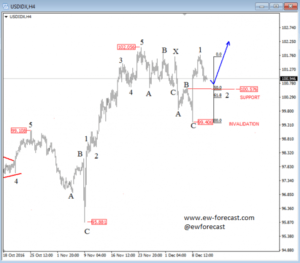
USD Index
USD index is in a strong uptrend since the US elections, a clear impulsive structure on the 4h chart that belongs to a bigger wave five from a weekly time frame. Recently as we can see, the price looks to have been undergoing a complex correction known as a double zig-zag that found some support at the 99.44 level, from where the price turned strongly bullish in the past week. As such, more upside could now follow on the USD Index, with the price trading in the second wave 2. The support for this corrective wave 2 could be around the previous wave B swing at 100.58, where even some Fibonacci ratios are seen and can react as reversal zones.
USD Index, 4H
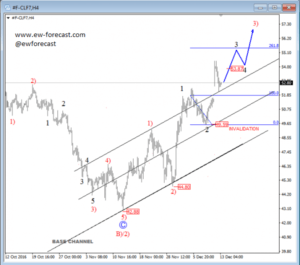
Crude OIL
Crude oil seem to be trading in a new uptrend, with red waves 1) and 2) completed and extended. Wave 3) is in motion after a bottom had been found at the 42.88 level, where a bigger correction had ended. As such, we now think the price could be trading at the middle of wave 3) specifically in minor wave iv), after a recent drop had occurred from the 54.48 level. That said, the current price action could be unfolding wave iv, that could point towards higher levels after its completion. The upper corrective channel line could now provide some support and even push the price higher above the 53.87 level within wave 3.
Crude OIL, 4H