Hello traders and good day. Today we are going to take a closer look at USDJPY checking it’s long and short term view.
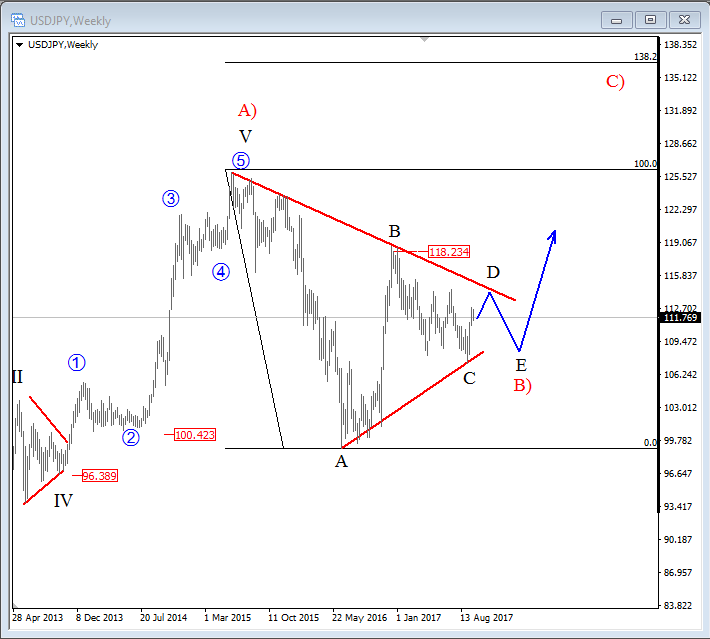
USDJPY has been trading choppy, slow and overlapping since 2015, which gives us an idea about a triangle pattern that can be in progress within a higher degree wave B). A triangle correction is a five-wave pattern, that usually unfolds prior to the final wave. This final wave in our case is labeled as the following red wave C). A triangle pattern also takes longer to fully unfold, rather then a simple zig-zag correction, meaning a further slowdown in price activity for this pair.
Specifically we see the price trading at the start of sub-wave D of B), that can search for resistance near the upper triangle line and from there make a new and final drop lower into leg E.
All being said, once the former swing high at 118.23 level gets breached, that is when wave B) correction will be considered as completed and wave C) will be on the move, towards new highs.
USDJPY, Weekly
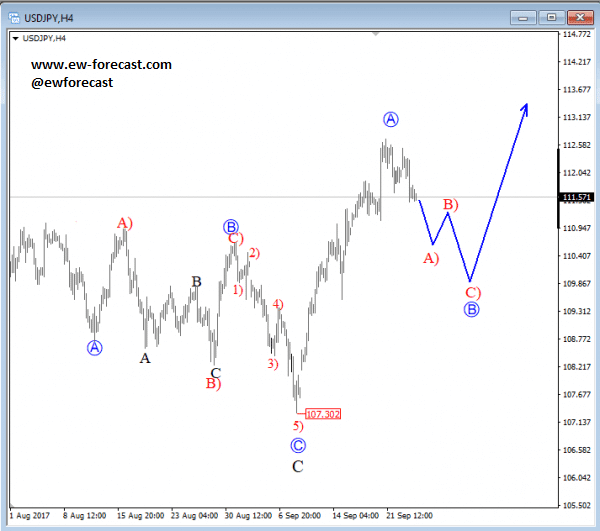
Now let us switch to the 4h time frame chart. Here we see wave C of a triangle completed at the 107.31 level. Indication and a confirmation for a completed wave C is a sharp leg towards the 113 region, which we labeled as blue leg A. This wave A is showing some evidences of a completion, which means sub-wave A) of B can now be on the move. Ideally a three-wave decline will now follow within the bigger blue wave B, before a new recovery higher will again come in play.
USDJPY, 4H
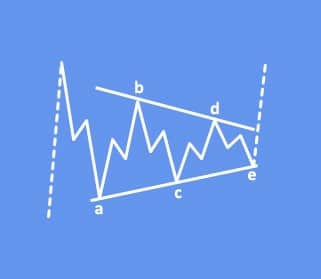
A closer look at a triangle correction.
A Triangle is a common 5-wave pattern labeled A-B-C-D-E that moves counter-trend and is corrective in nature. Triangles move within two channel lines drawn from waves A to C, and from waves B to D. A Triangle is either contracting or expanding depending on whether the channel lines are converging or expanding. Triangles are overlapping five wave affairs that subdivide 3-3-3-3-3.
Triangles can occur in wave 4, wave B, wave X position or in some very rare cases also in wave Y of a combination.
An example of a triangle correction: