- Elrond price has dropped by 25% since the TD Sequential indicator presented a sell signal on the daily chart.
- The digital asset is right above a crucial support level on the 1-hour chart.
- If EGLD bulls can hold $161, Elrond can see a significant rebound towards $190.
Elrond had a massive bull rally during 2021 reaching an all-time high of $217 and a market capitalization of around $3.5 billion. After a massive run, the digital asset has experienced a significant 30% correction down to $147.
Elrond price is at the doors of a key support level
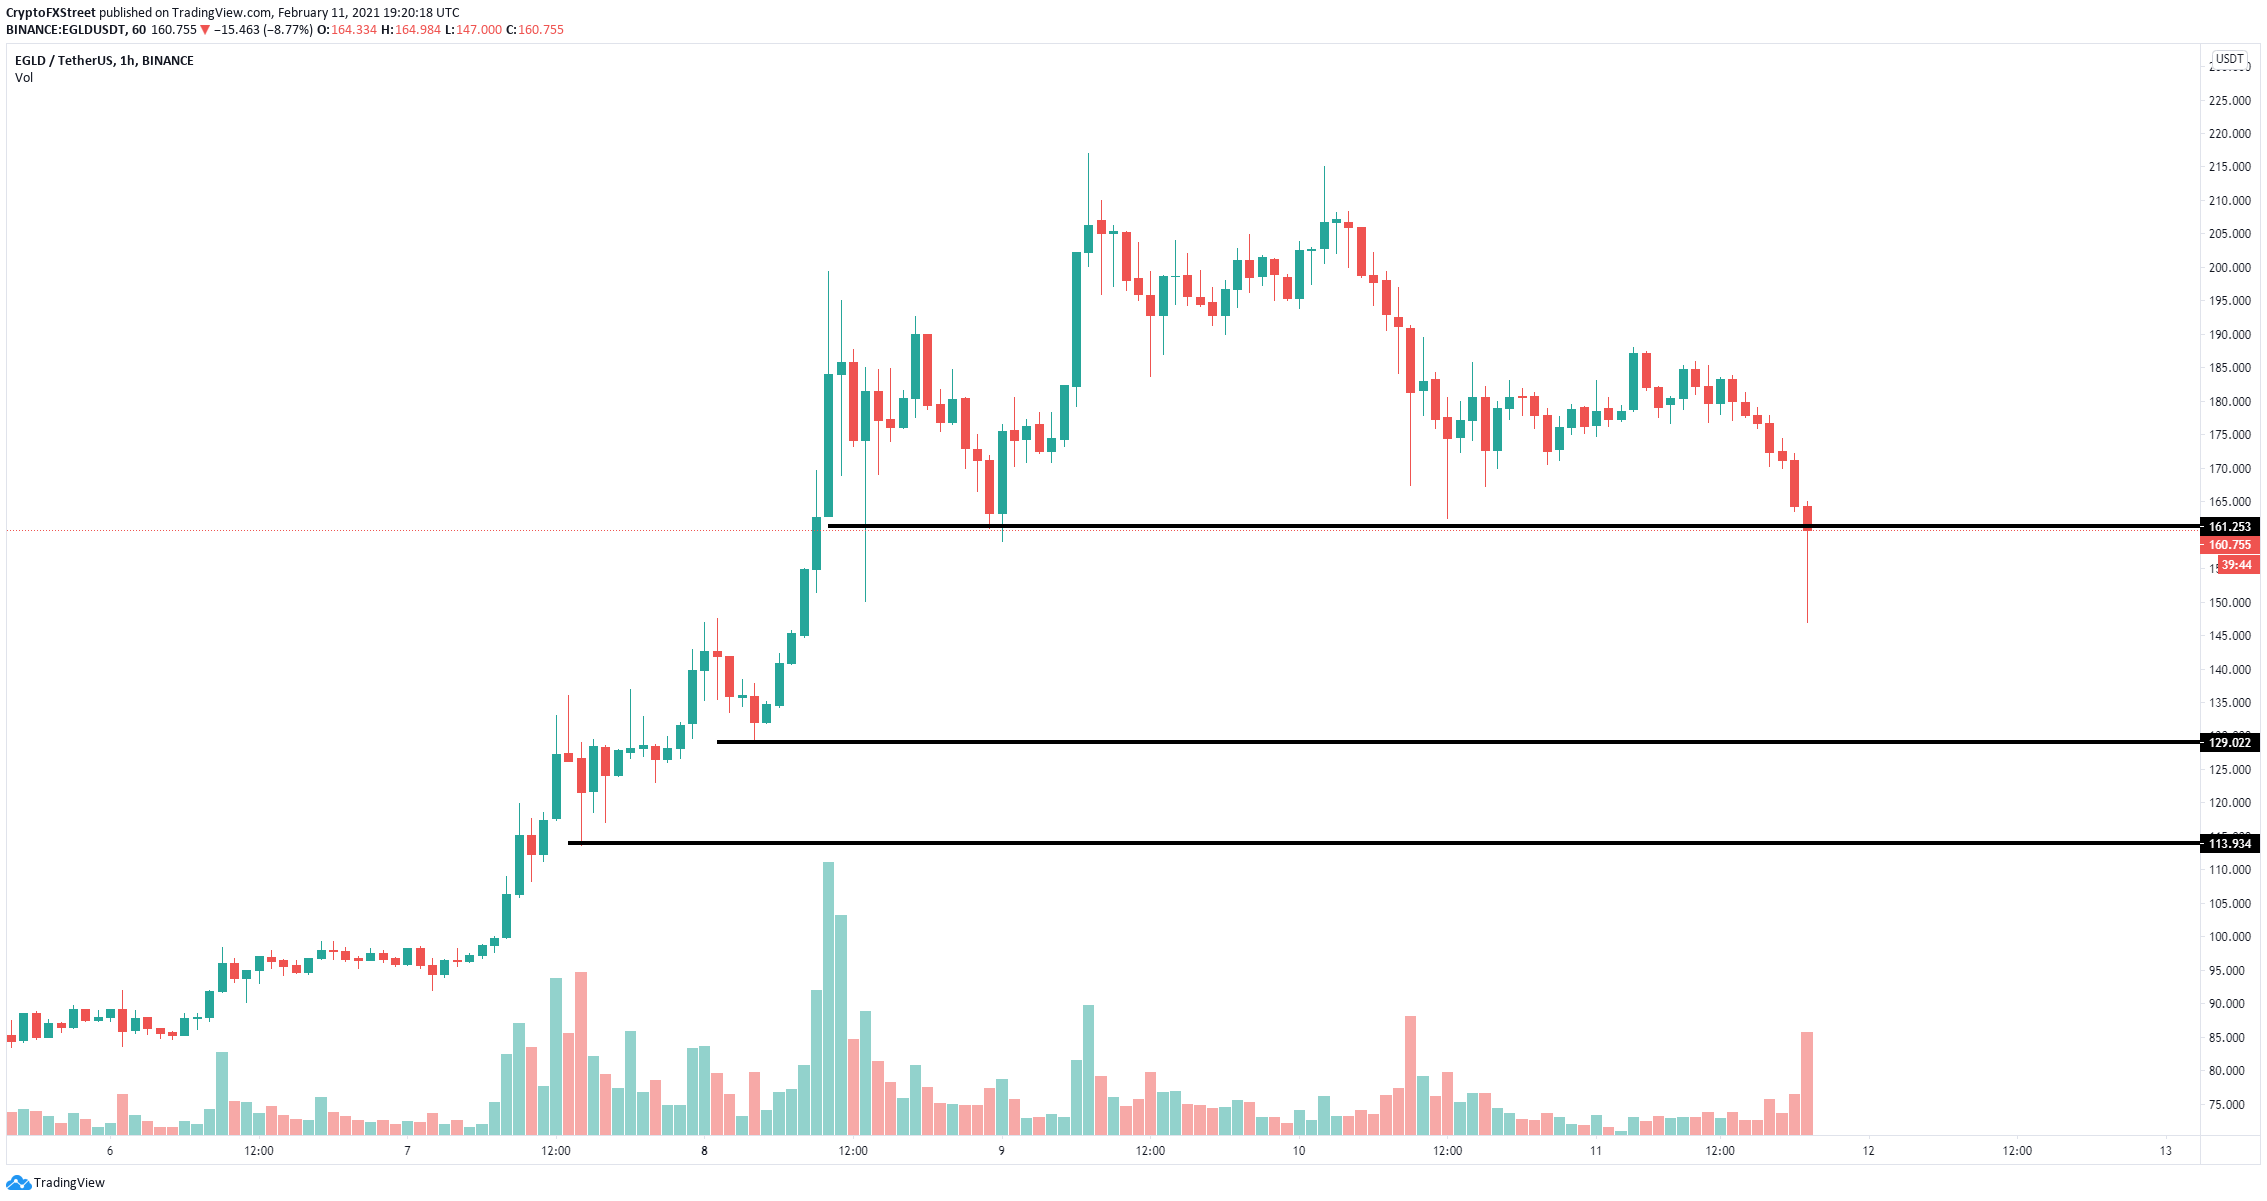
On the 1-hour chart, there is a critical support level formed at $161. So far, EGLD bulls have held this level as the current candlestick hasn’t closed below it. Losing this level can push Elrond price down to $129 which is the next significant support level.
EGLD/USD 1-hour chart
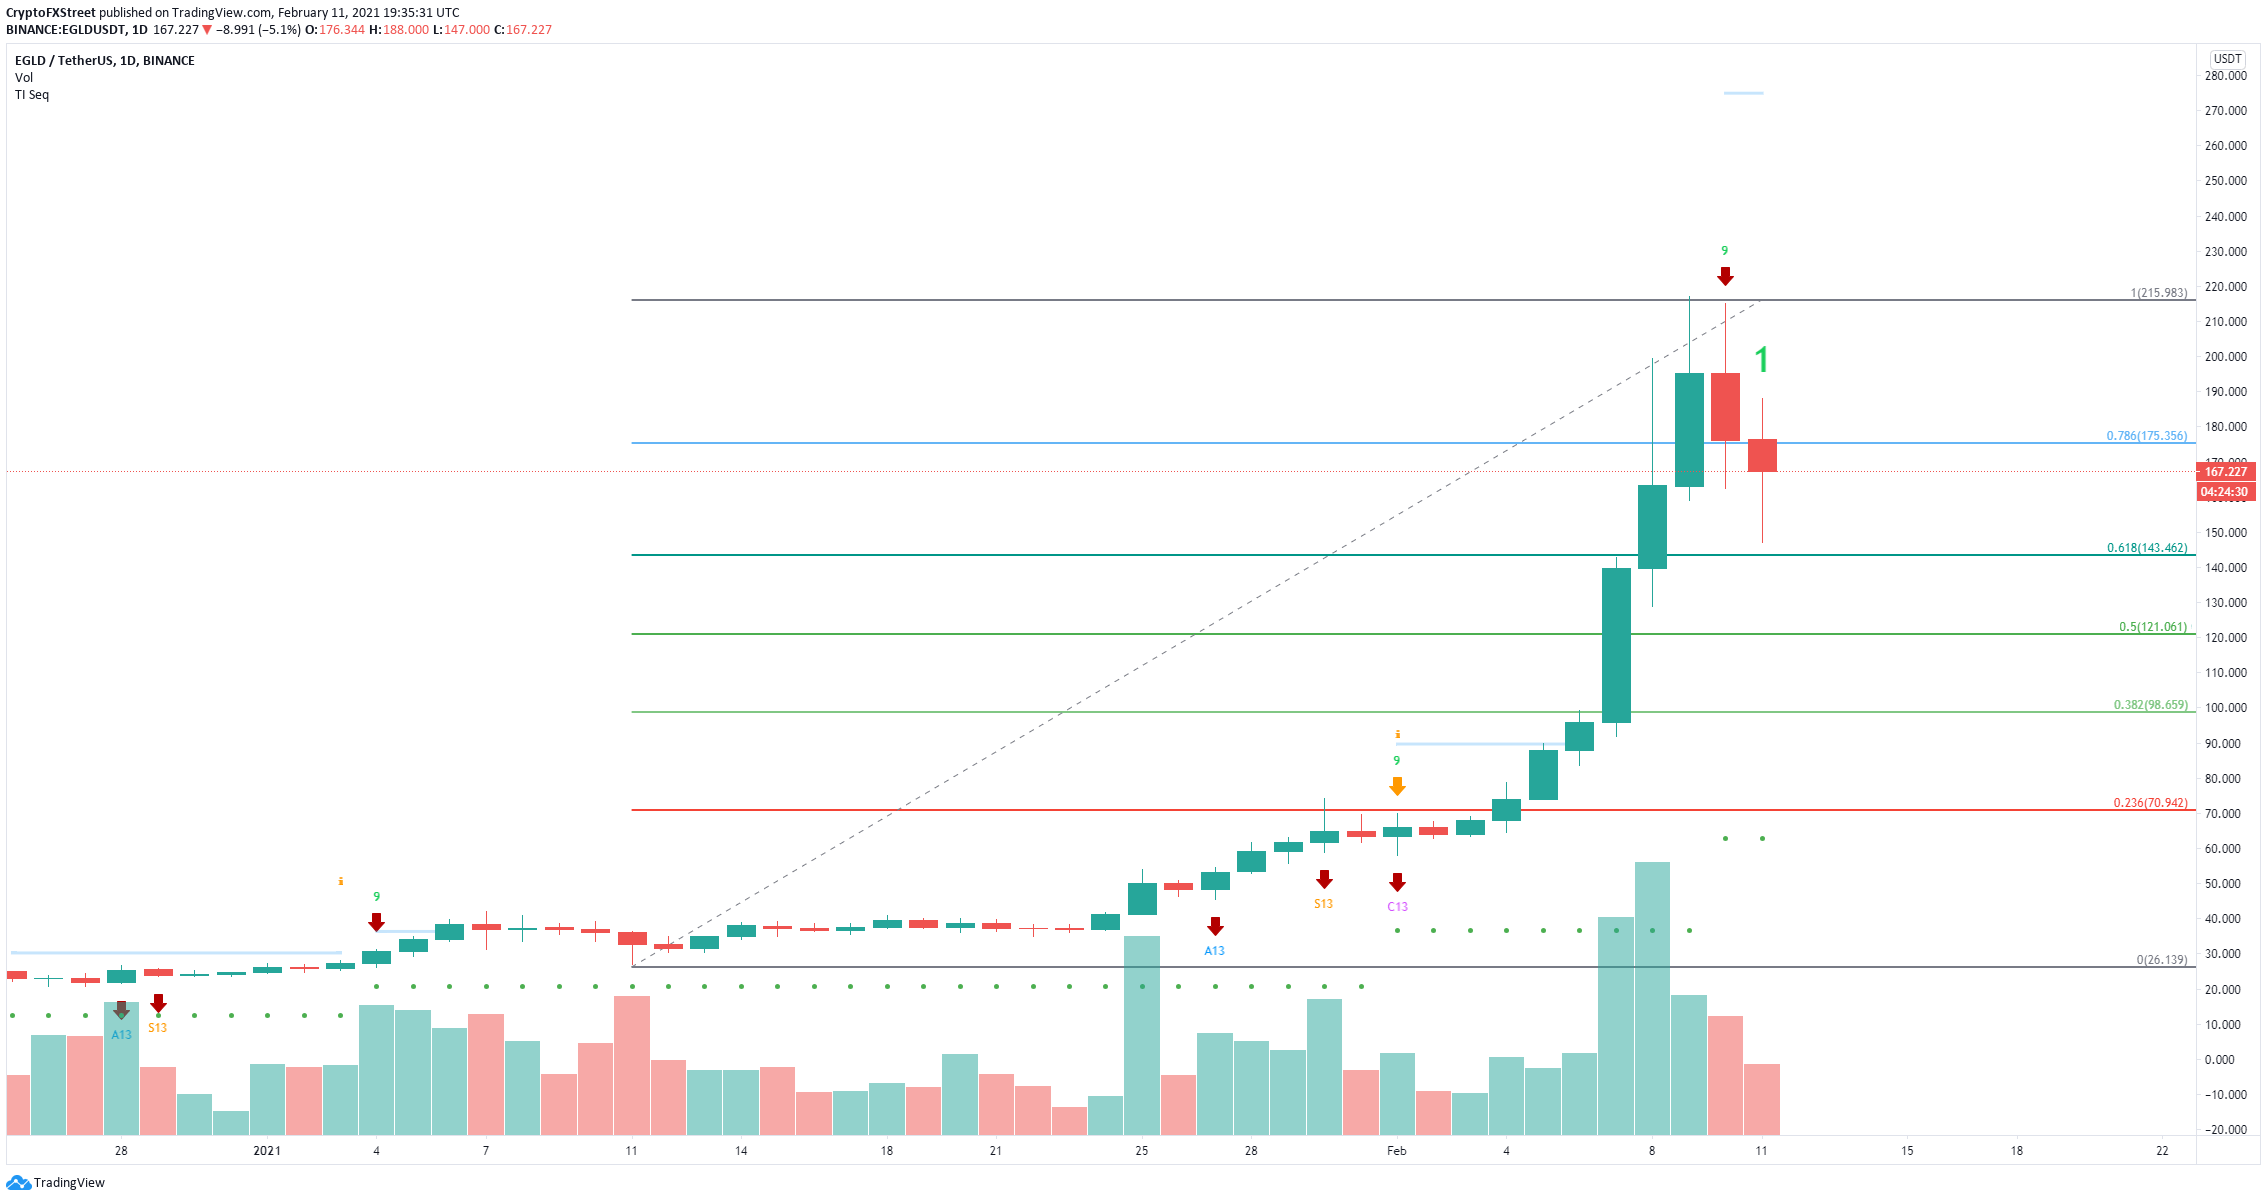
On the daily chart, the TD Sequential indicator presented a sell signal on February 10 which is getting a lot of bearish continuation. Using the Fibonacci Retracement tool, we can find out potential price targets. The nearest is $143, which was hit already. The 50% Fib level is located at $121 which almost coincides with the $129 level stated above.
EGLD/USD daily chart
On the other hand, if the bulls can hold the critical support level at $161, the rebound could push Elrond price towards $190.


