- EOS/USD price has peeked above the triangle pattern.
- The MACD indicator shows increasing bullish momentum.
EOS/USD daily chart
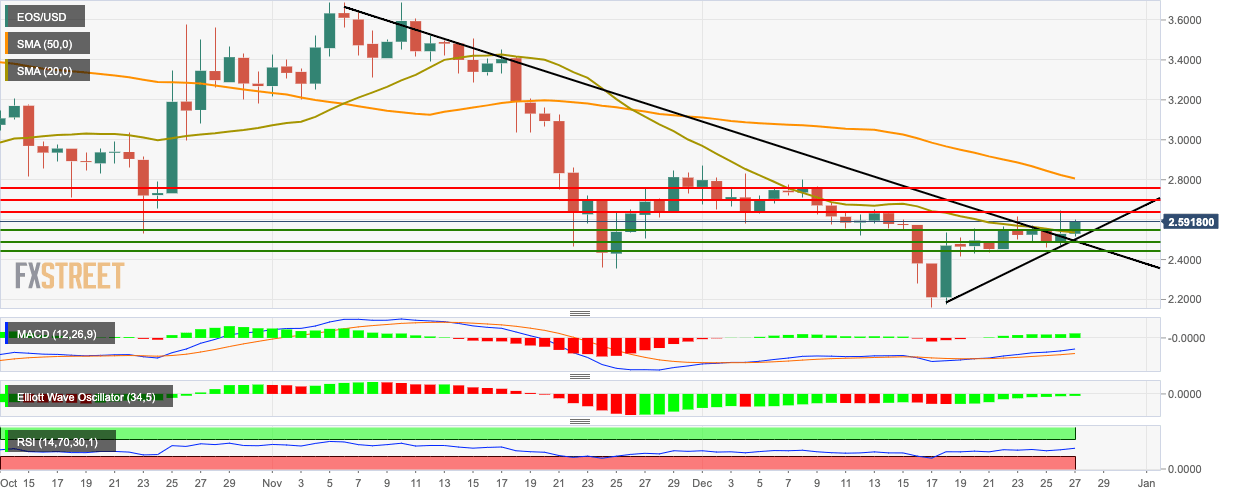
EOS/USD has gone up from $2.53 to $2.58 this Friday, charting a second straight bullish day. In the process, the price sessions broke above the triangle pattern and the 20-day Simple Moving Average (SMA 20) curve. The Moving Average Convergence/Divergence (MACD) indicates increasing bullish momentum, while the Elliott Oscillator shows sustained bullish sentiment. The Relative Strength Index (RSI) indicator is hovering around the neutral zone, which shows that further bullish action can be expected.
