- EOS/USD gets knocked back again by sellers within the $12.50 area, several tops produced here over the last week.
- Wedge pattern currently dictating price action, however this could also be viewed as a bearish pennant.
The EOS price lost some ground after a bullish session on Tuesday, nursing losses on Wednesday of 2.5%. EOS/USD bulls continue to falter around $12.50, as has been the case since 25th May, producing several tops within this area.
EOS/USD continues to be dictated by a wedge pattern that has formed, which could also be viewed as a bearish pennant formation. Since bouncing off the extreme lows on 24th May at around $10.40, fortunately finding feet within a demand zone.
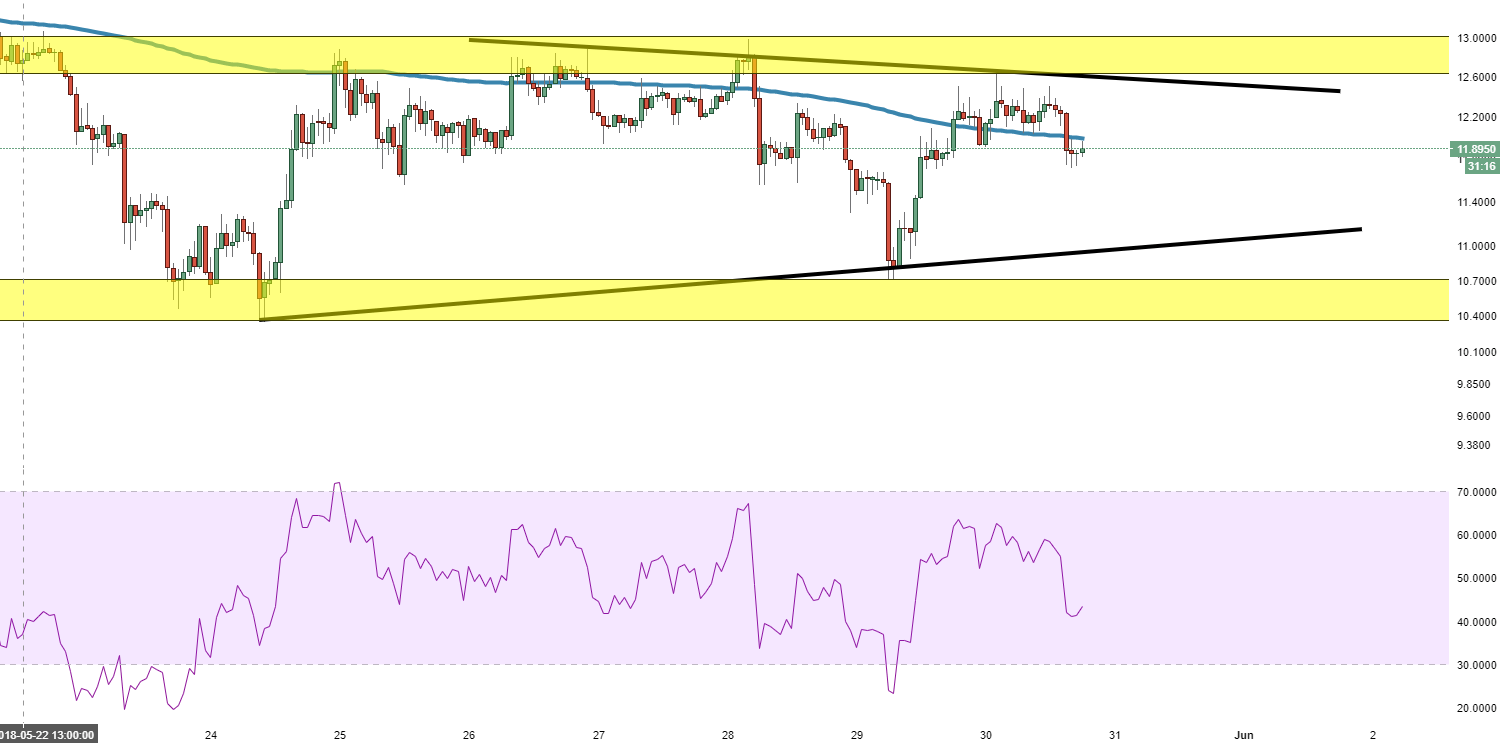
It may be a short while before EOS/USD is able to move above $13, due to the strength of resistance in its way. As mentioned above, $12.50 region is a barrier, further north $12.60-13.00 is a touted supply zone, an area the price has not been above since 22nd May. Support in the near-term is seen at the session’s lows $11.72 and then $11.55 (support on 60-minute chart).
EOS/USD 60-minute chart