- EOS price is still limited below the 23.6% Fibo close to $9.3.
- 100 SMA is offering immediate support at $8.69, but the major support is at $8.00.
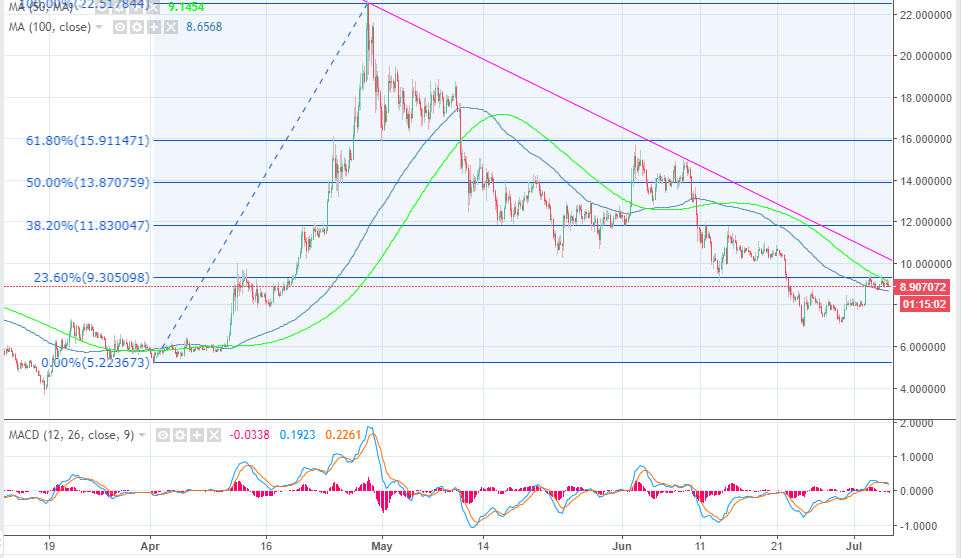
EOS price failed to maintain the upside momentum above $9.00 and instead it has dipped into the $8 range. An upside movement was initiated around $7.9 at the beginning of July, although the sharp jump was limited by the 23.6% Fib retracement level with the previous swing high of $22.6 and a low of $5.22 close to $9.3.
The price is currently dancing between the moving averages on the 4-hour chart. The 50 SMA is preventing the gains on the upside at $9.22 while the 100 SMA is offering immediate support at $8.69. In spite of the bullish trend this July, EOS/USD is still trading below the multi-week bearish trendline as seen on the chart.
The long-term upper supply zone is highlighted at $10.00 and if EOS trades and consolidate above this area, then we could see it attack the critical area around $14.00 in the long-term. Aside from the support at the 100 SMA, the price is also supported at $8.00 (former resistance zone.
EOS/USD 4-hour chart